Case study · Capital Analytics
Capital Analytics
A website redesign for Capital Analytics, the business media platform behind the Invest: economic reports, events and video across twenty U.S. markets.
01 — Context
Business intelligence, in twenty cities
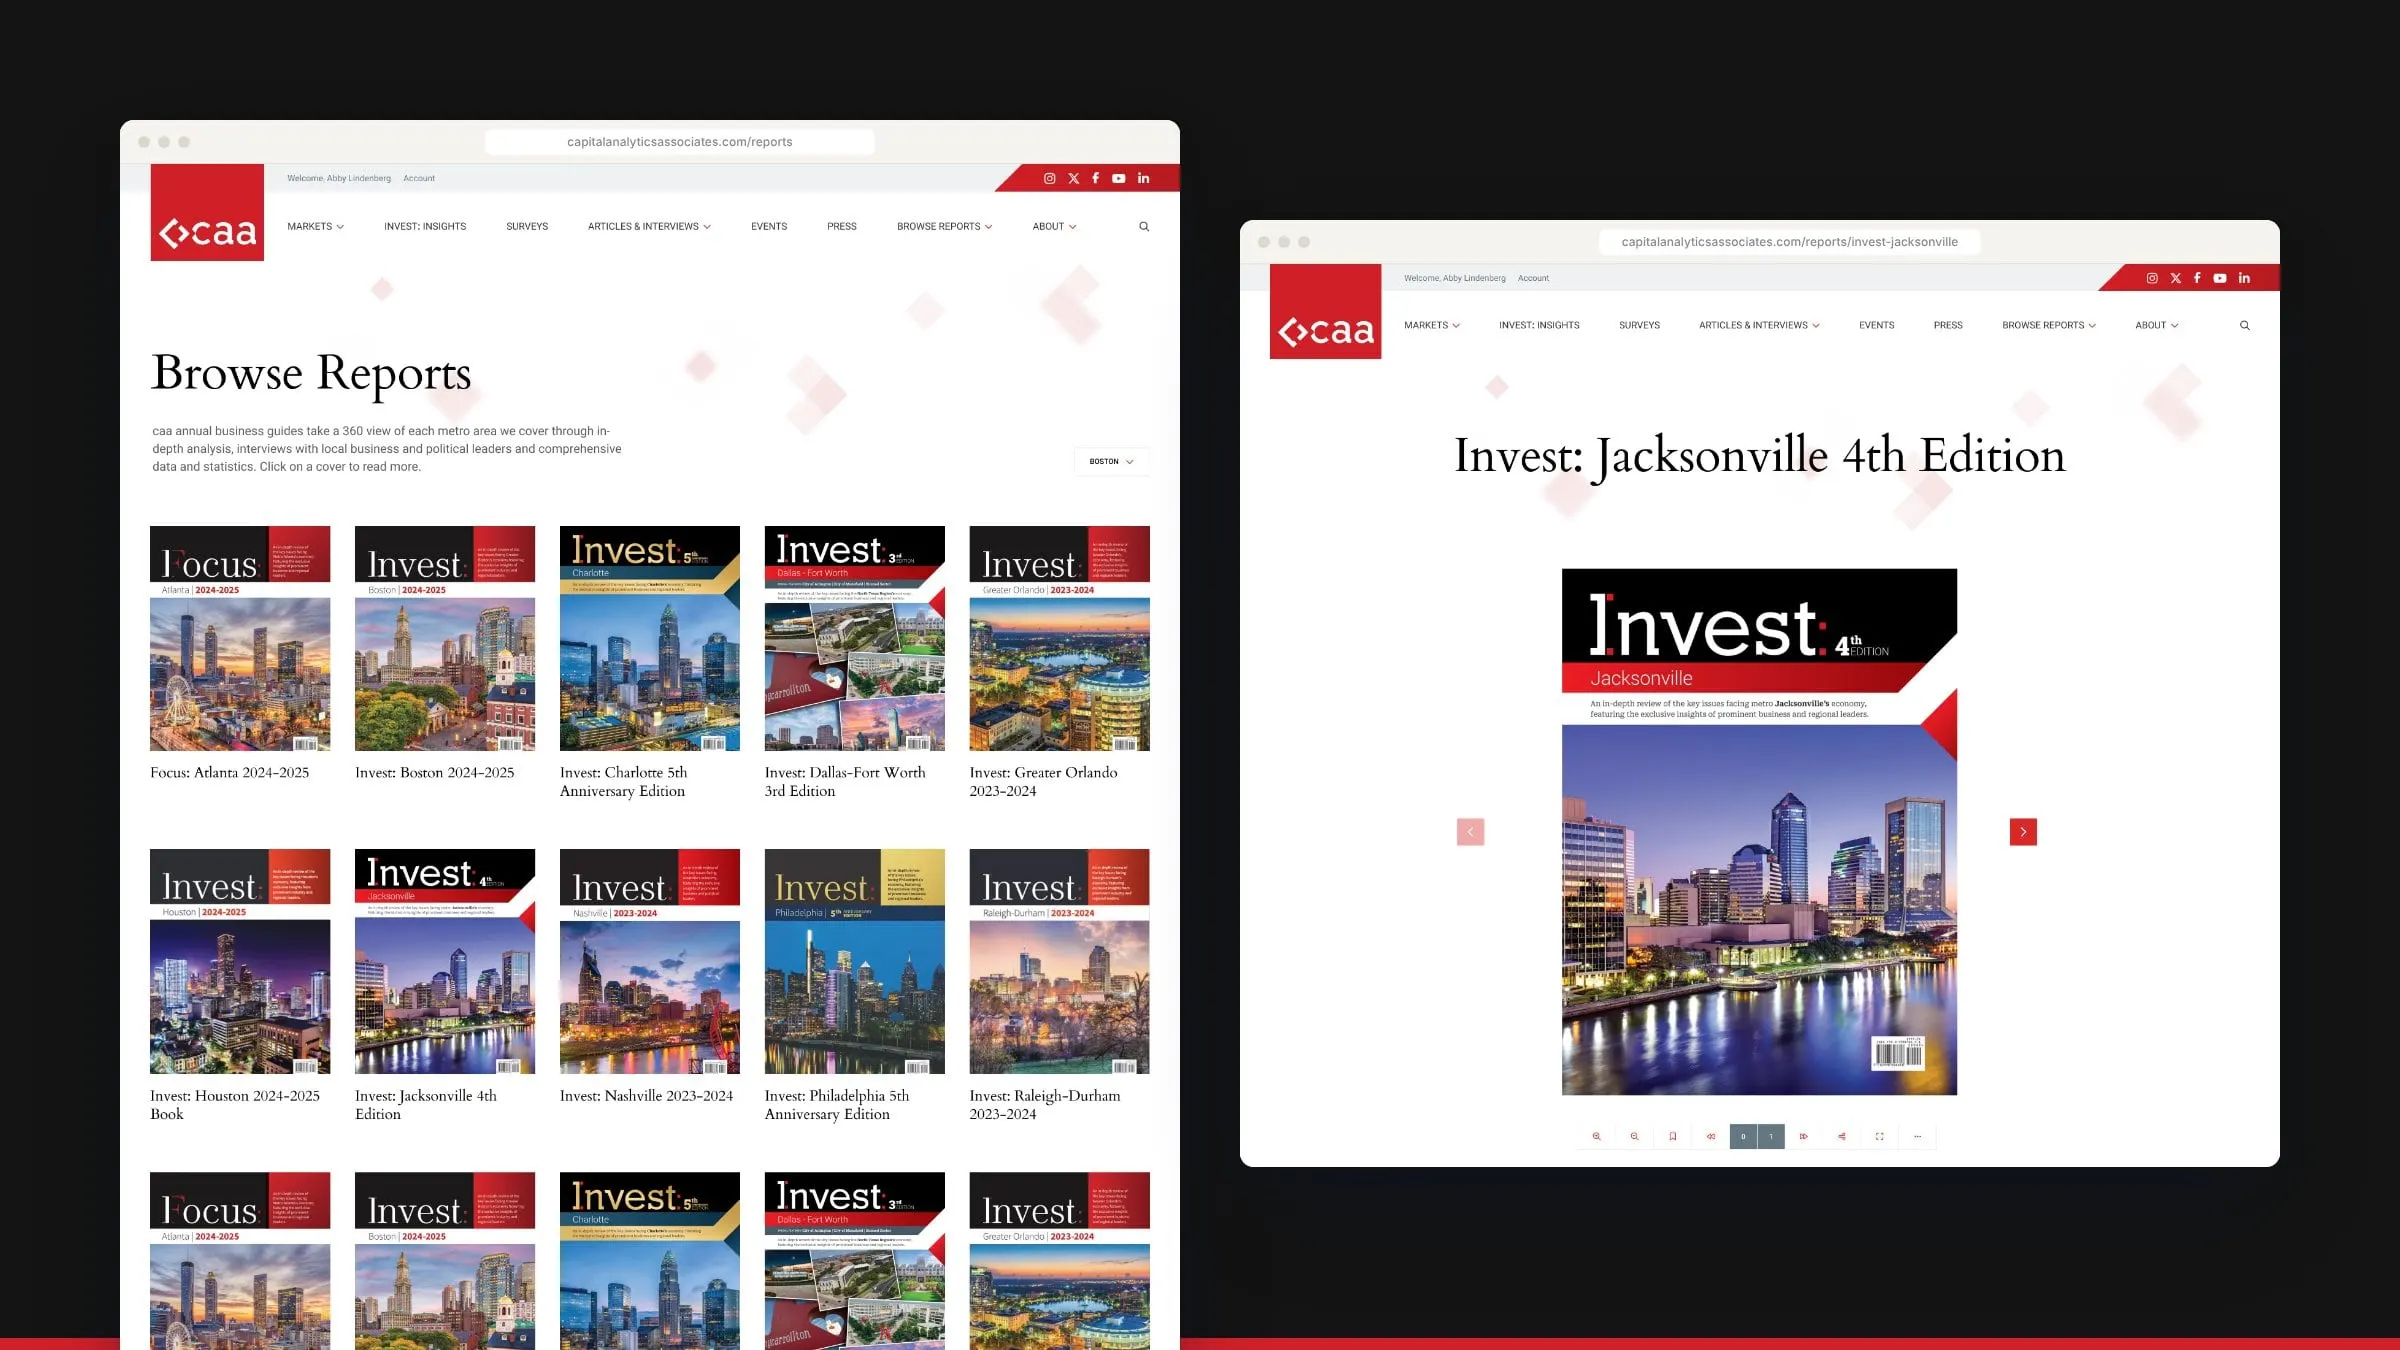
Capital Analytics is an integrated media platform that produces in-depth business intelligence across U.S. metro markets. Its flagship is the Invest: series, annual print and digital economic reviews of around 200 pages, each built from interviews with more than 200 public and private sector leaders over a six to eight month research period. Around the reports sit launch conferences and leadership summits, weekly articles, a business sentiment survey and the Invest: Insights video and podcast series.
That’s a lot of content across a lot of cities, from Boston and Charlotte to Houston, Miami and Tampa Bay. Capital Analytics asked us to redesign the website so all of it could be found, read and sold around, market by market.
Scope
A publisher’s site, at full scale
Counted from the final design file.
- Page designs
- 30Including reports, markets, events, articles, surveys, video and author pages.
- U.S. markets
- 20Each with its own market page, report shelf and event listings.
- Mega menus
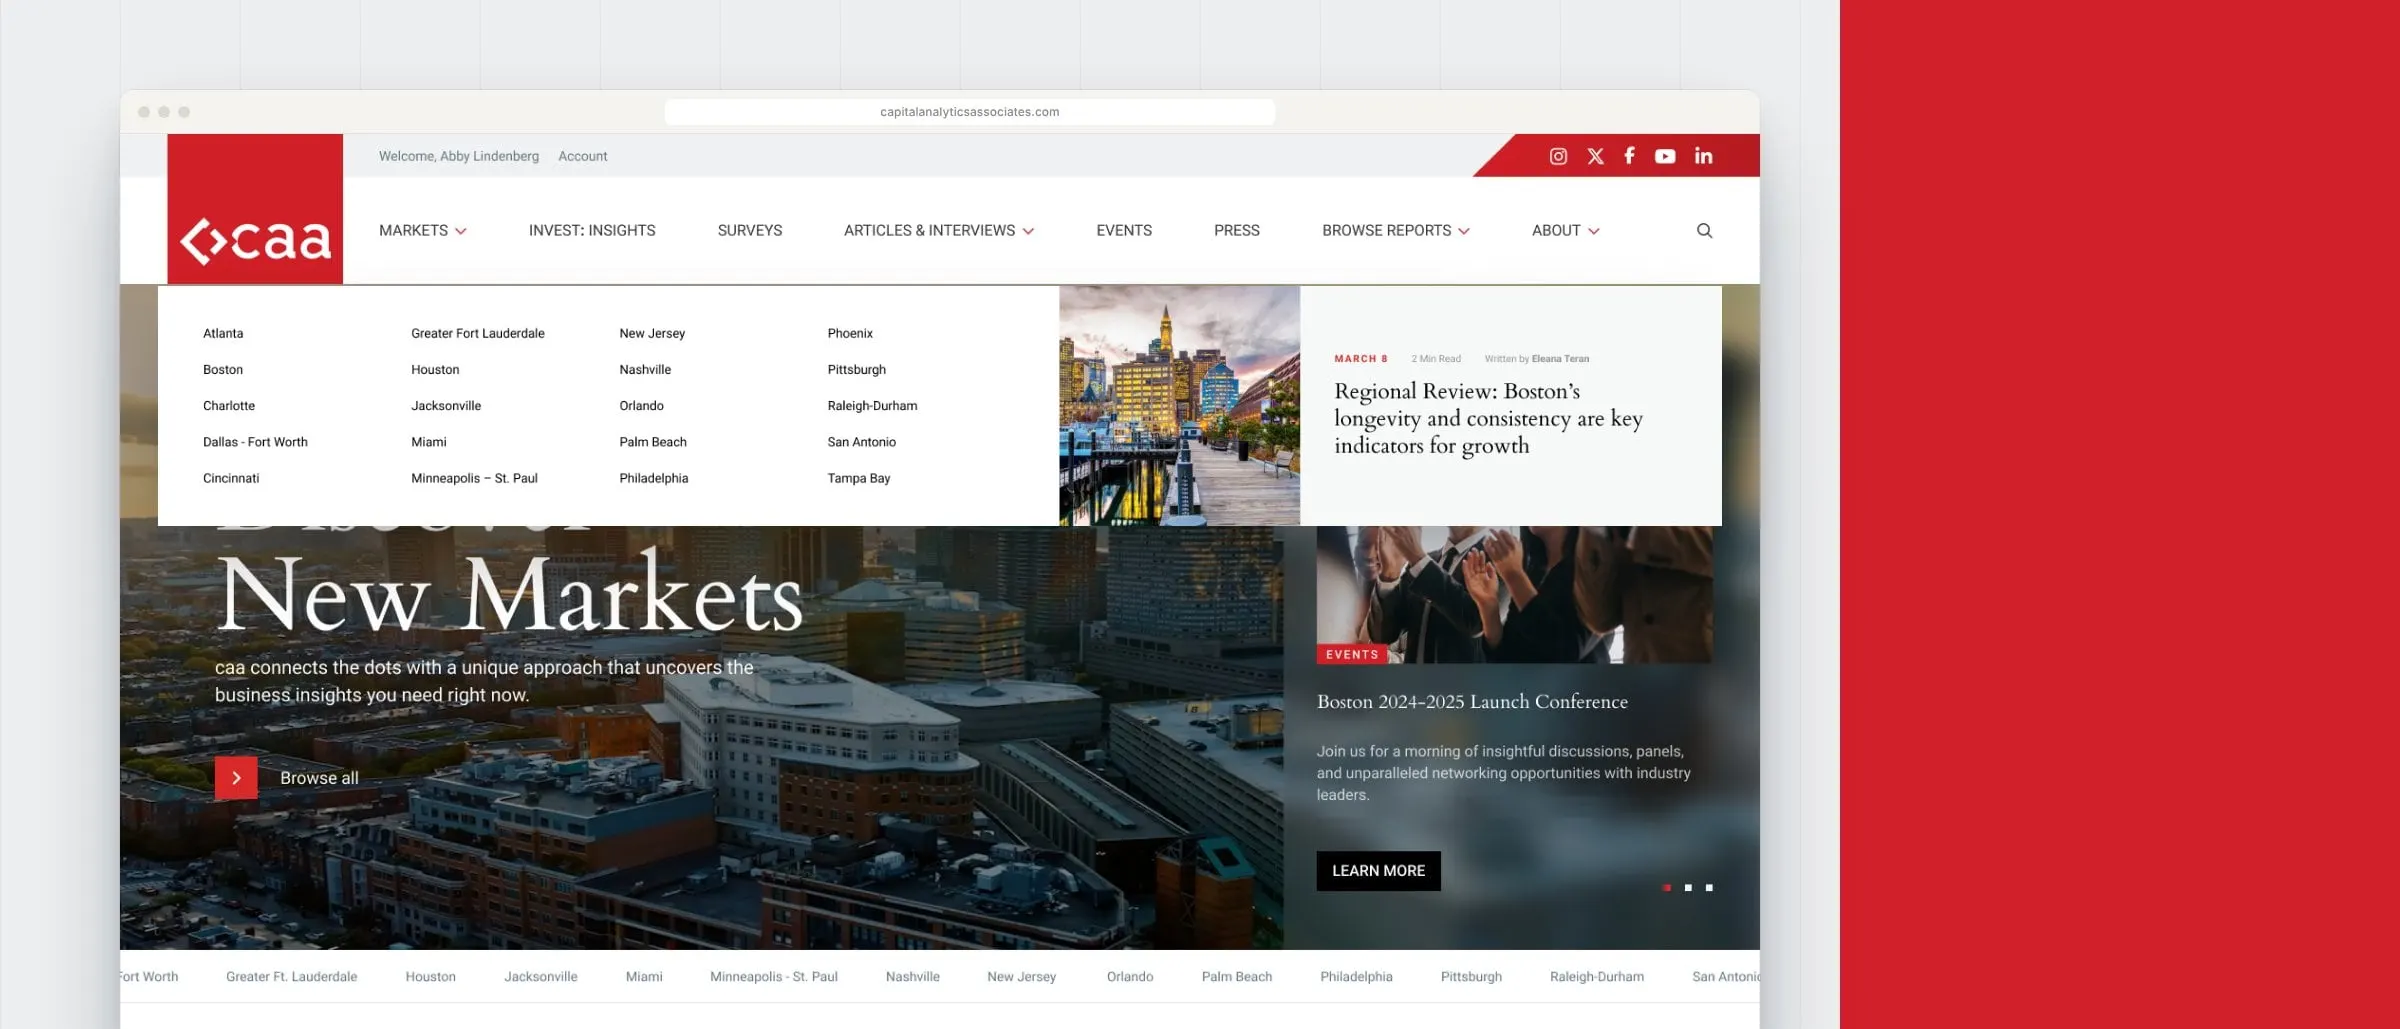
- 4Markets, Articles & Interviews, Browse Reports and About.
- Market banners
- 19Custom headers for each market page, from Atlanta to Tampa Bay.
02 — Structure
Every story has a city attached
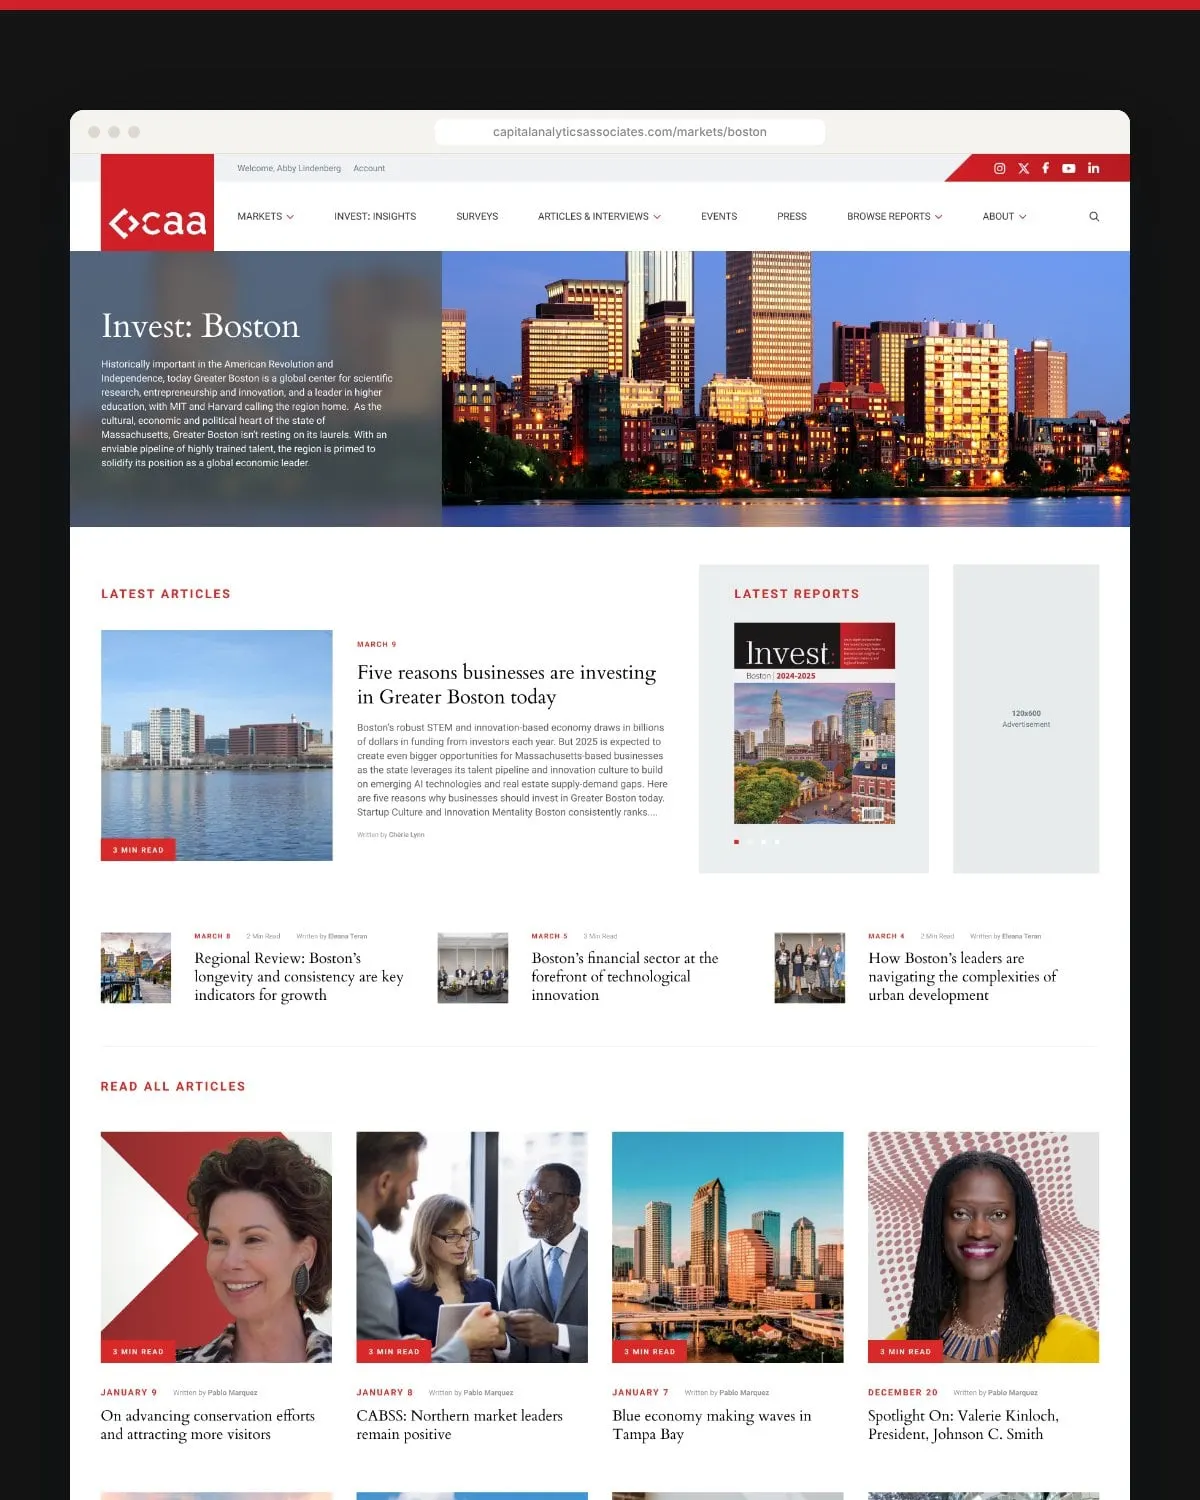
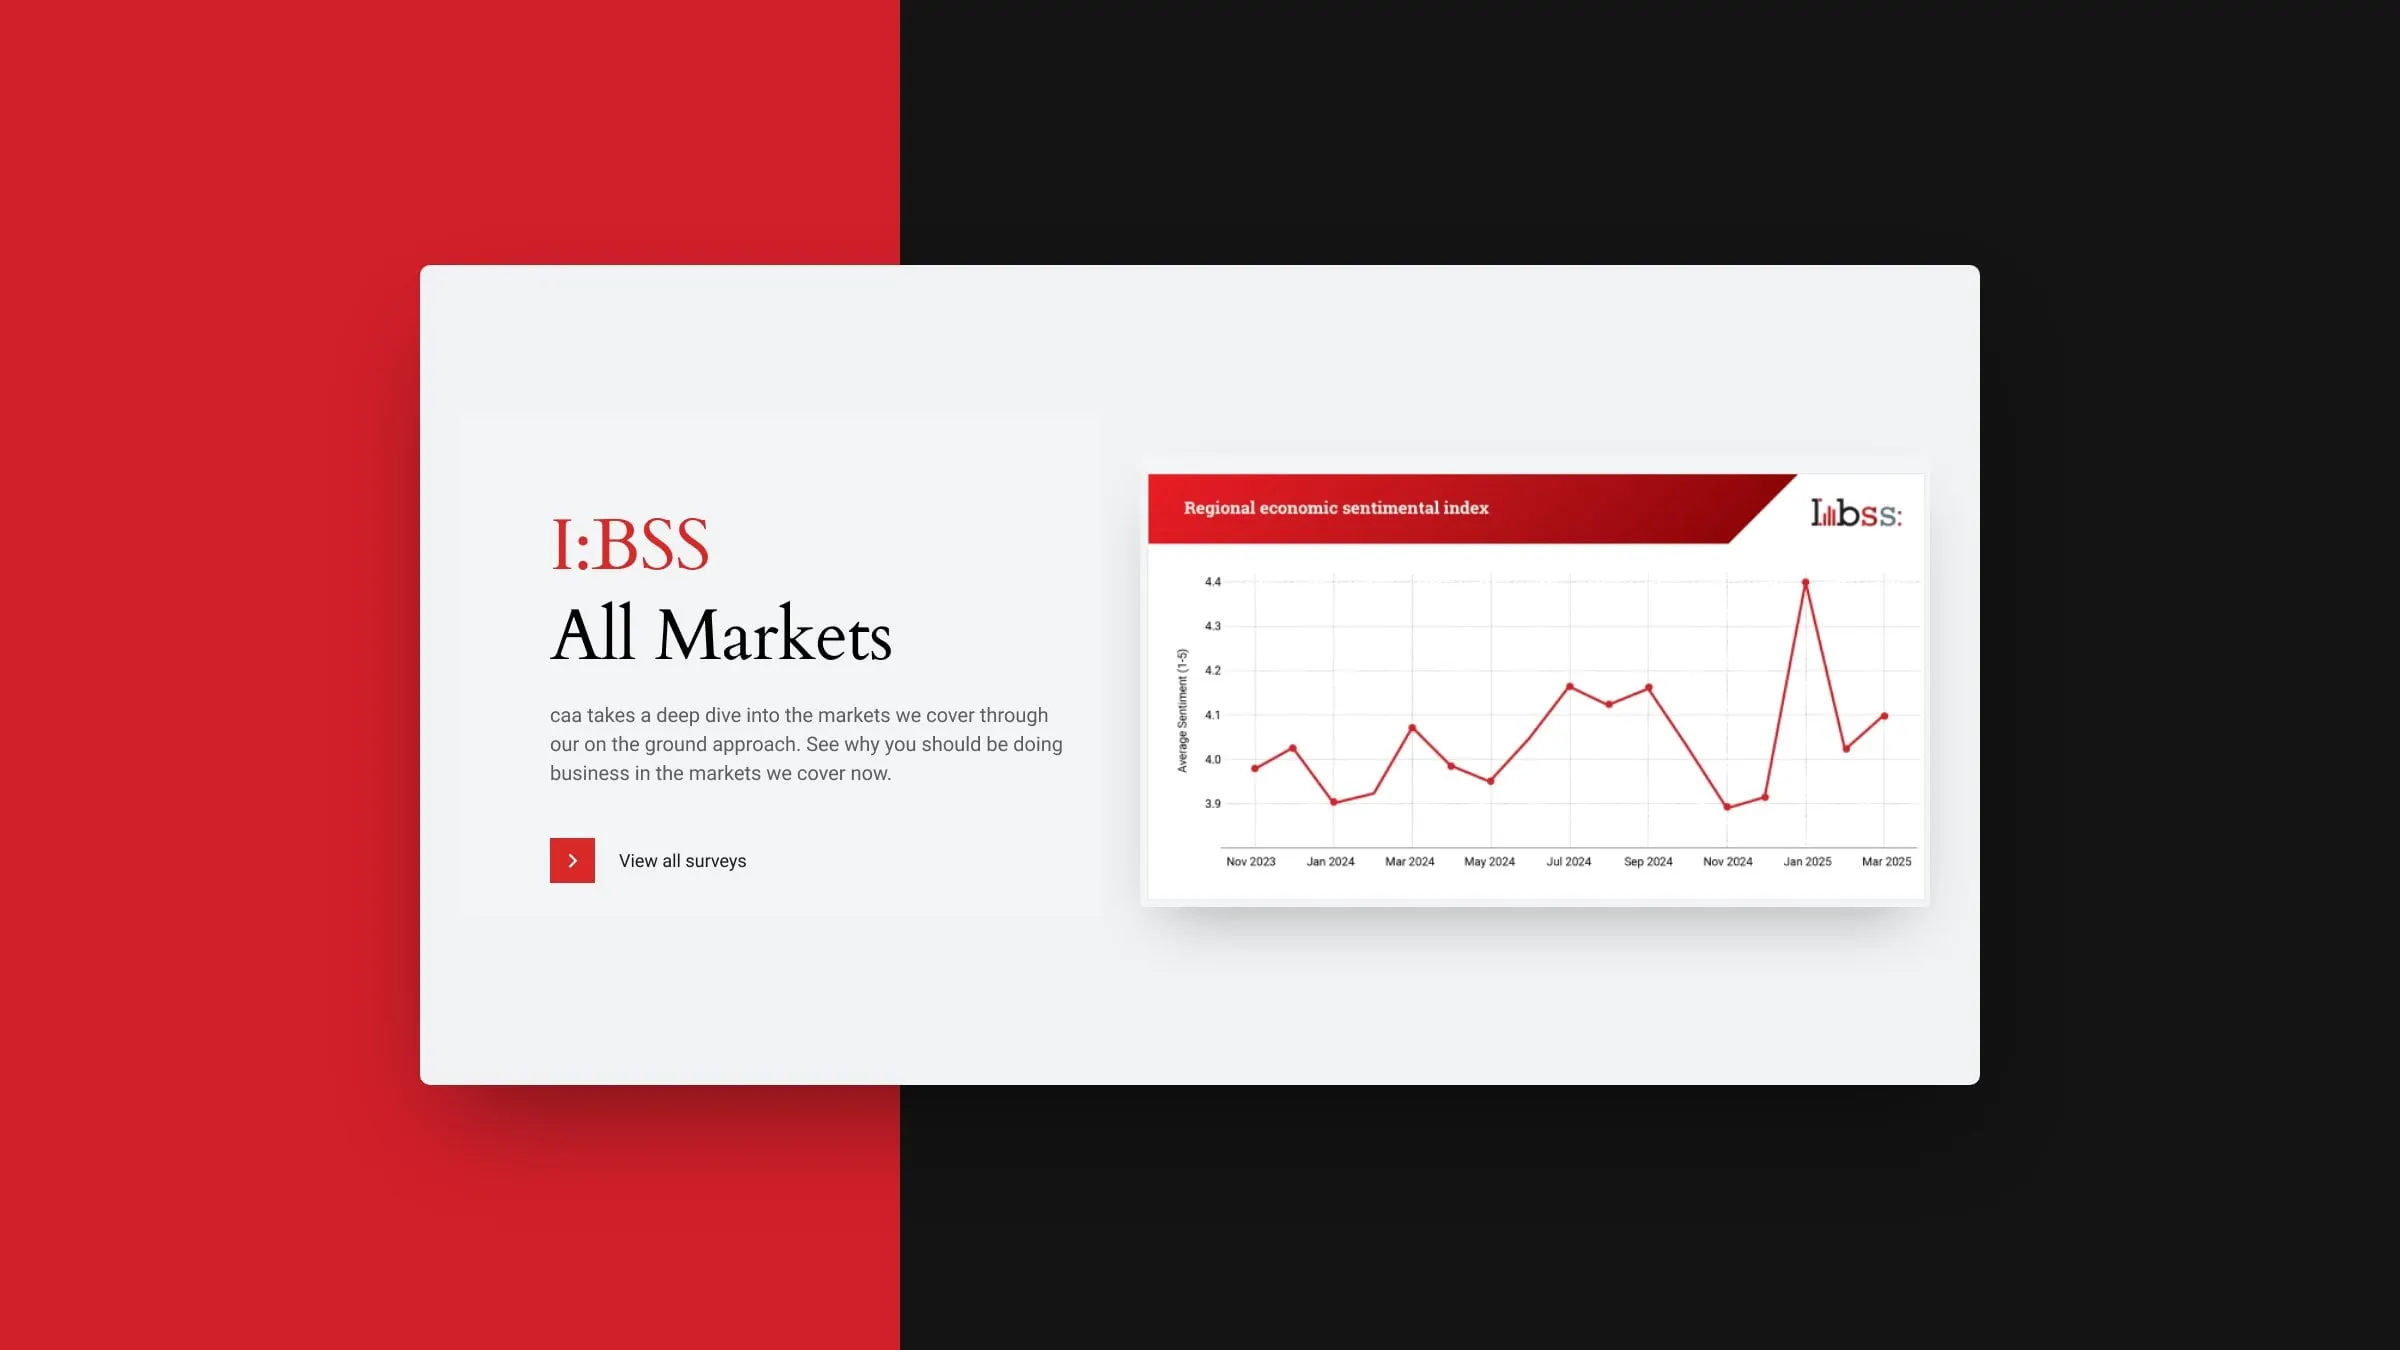
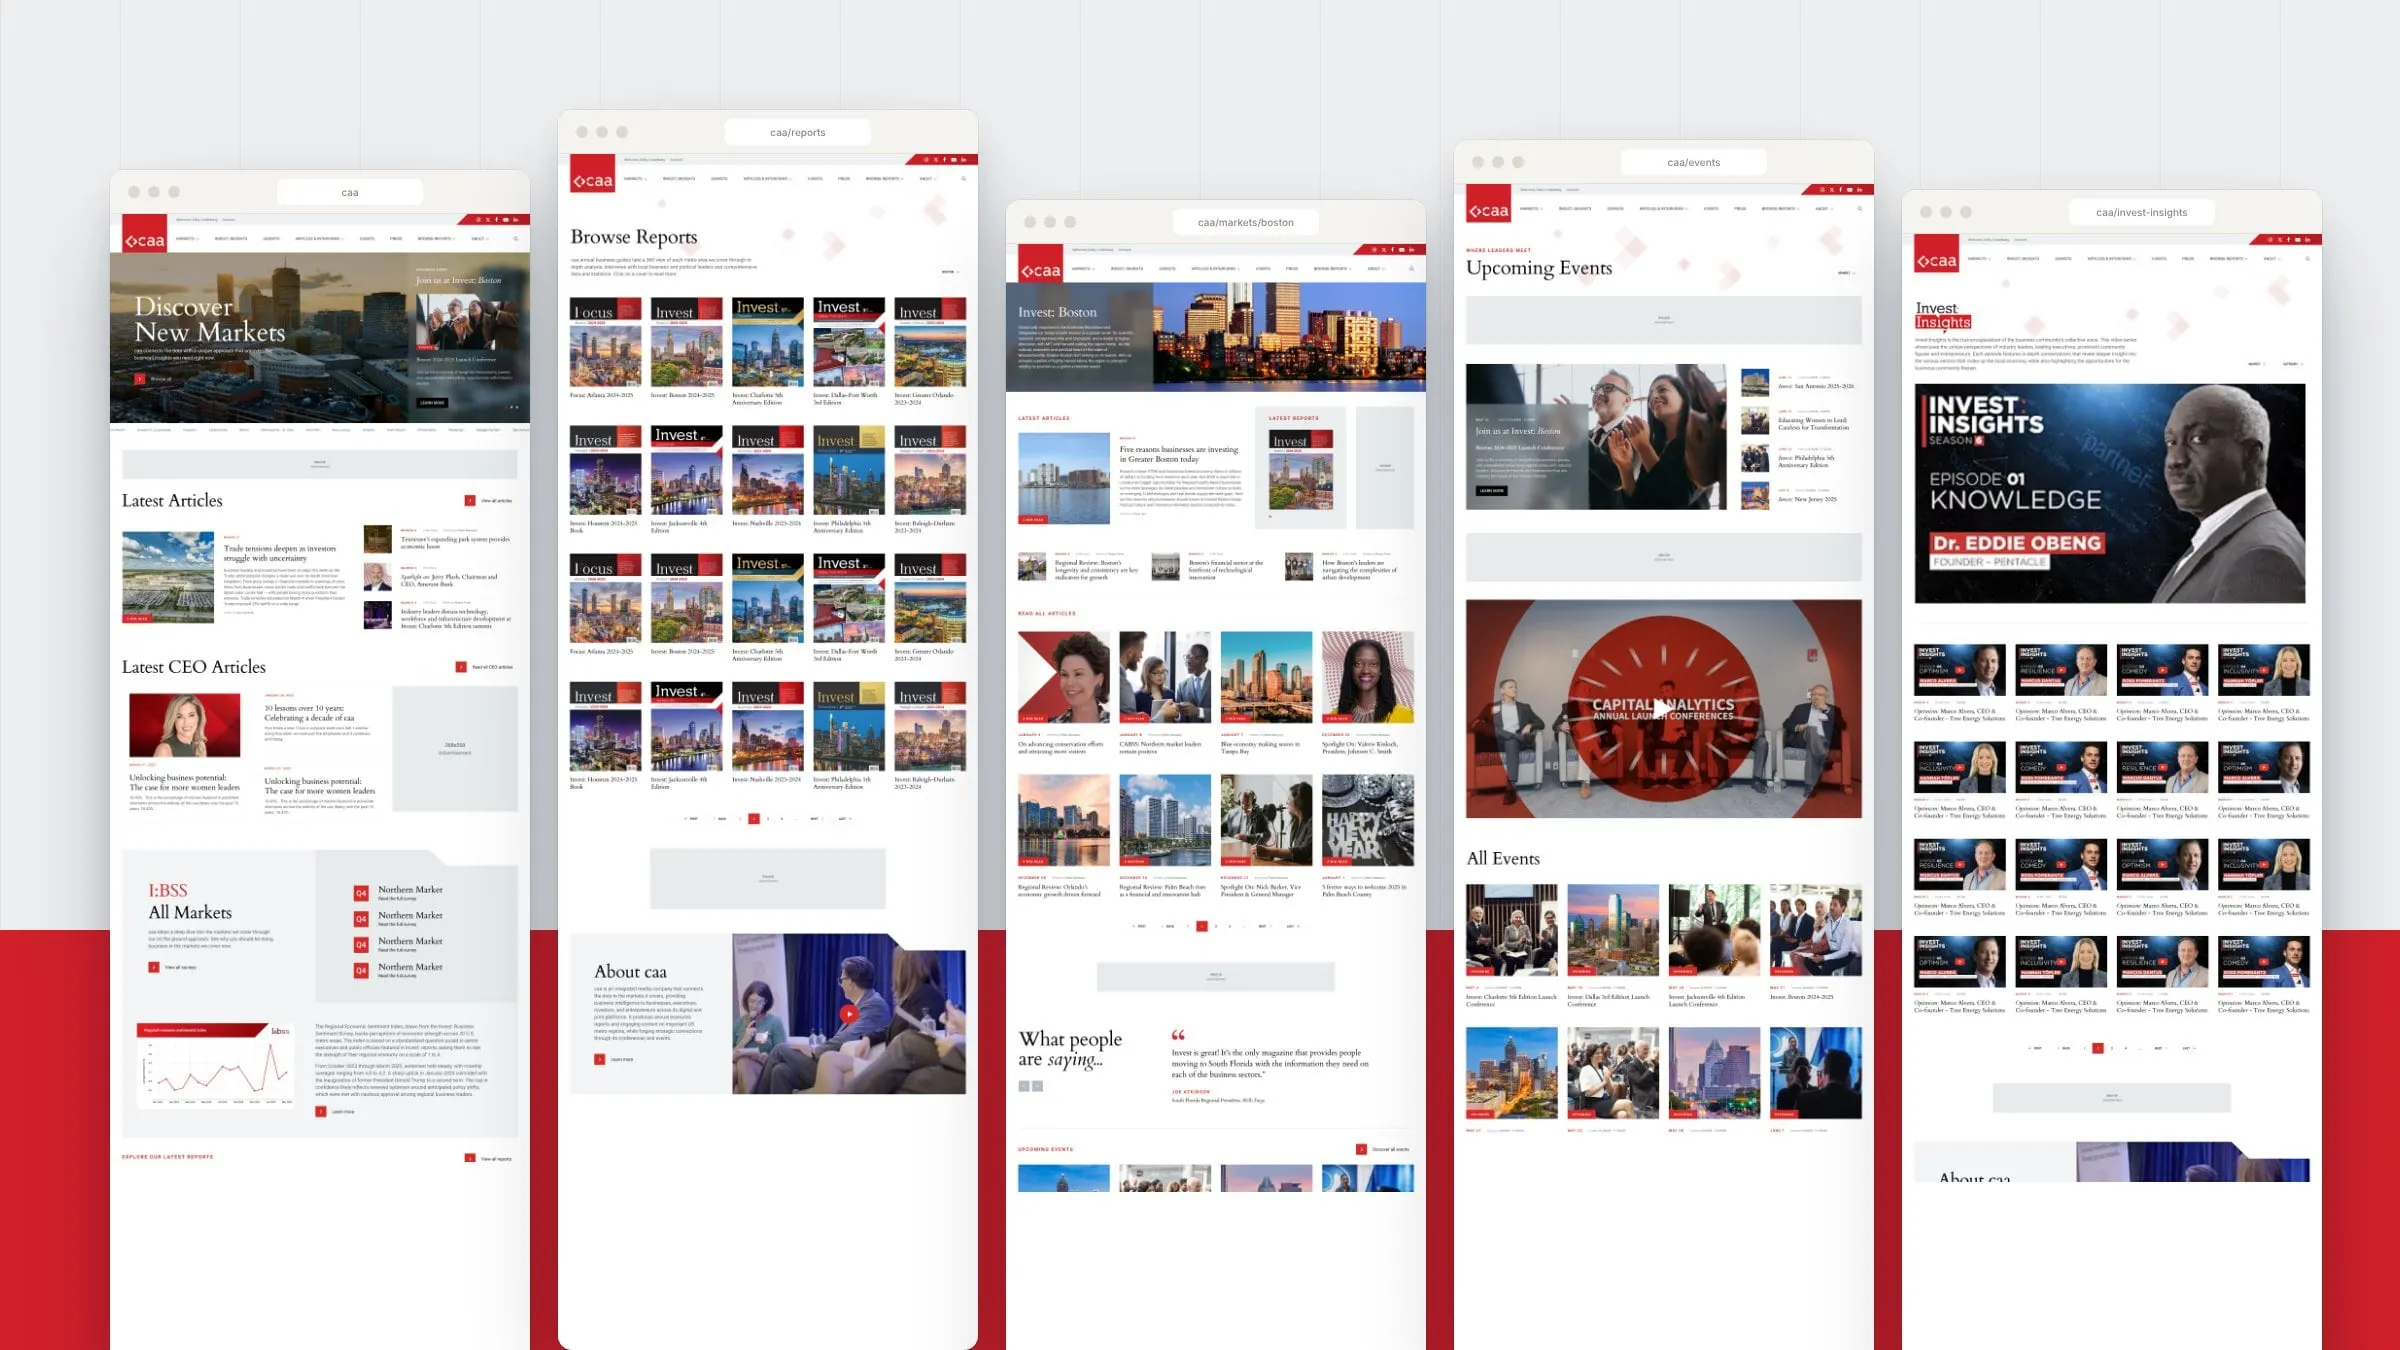
We organized the site around the two ways people actually look for business news: by place and by type. The main menu covers Markets, Invest: Insights, Surveys, Articles & Interviews, Events, Press and Browse Reports, and the big sections open into mega menus. Choose a city and you land on a market page that gathers its latest articles, its current report, upcoming events and readers’ testimonials in one place.
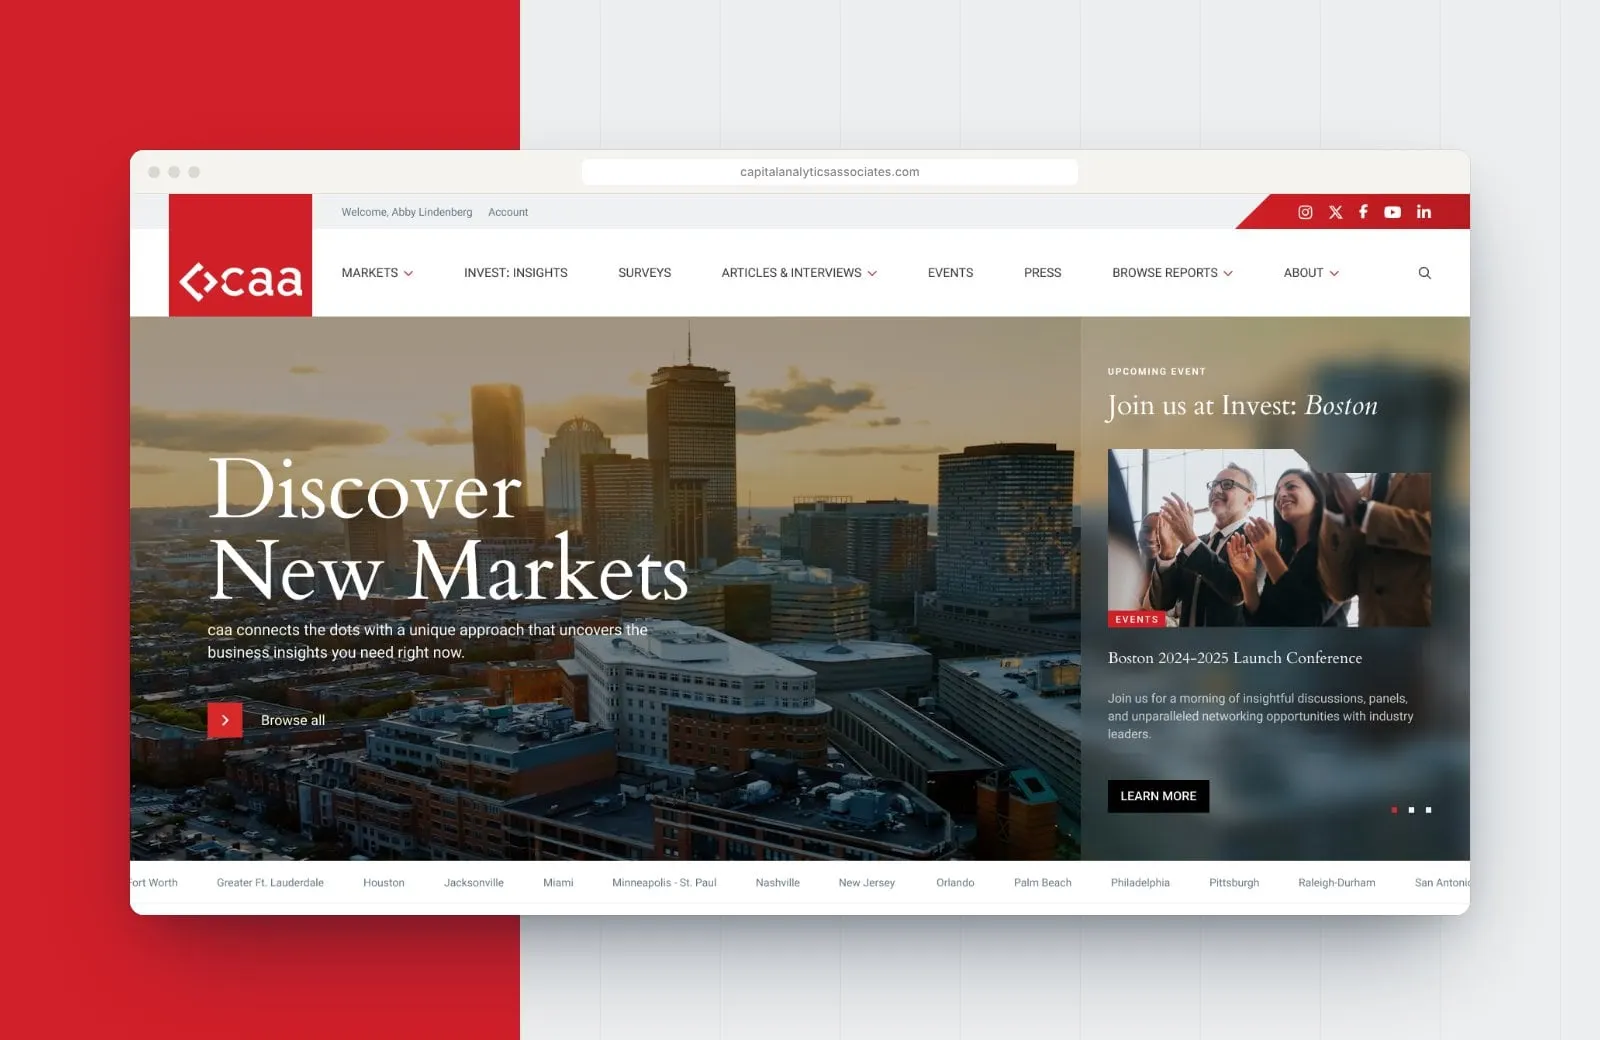
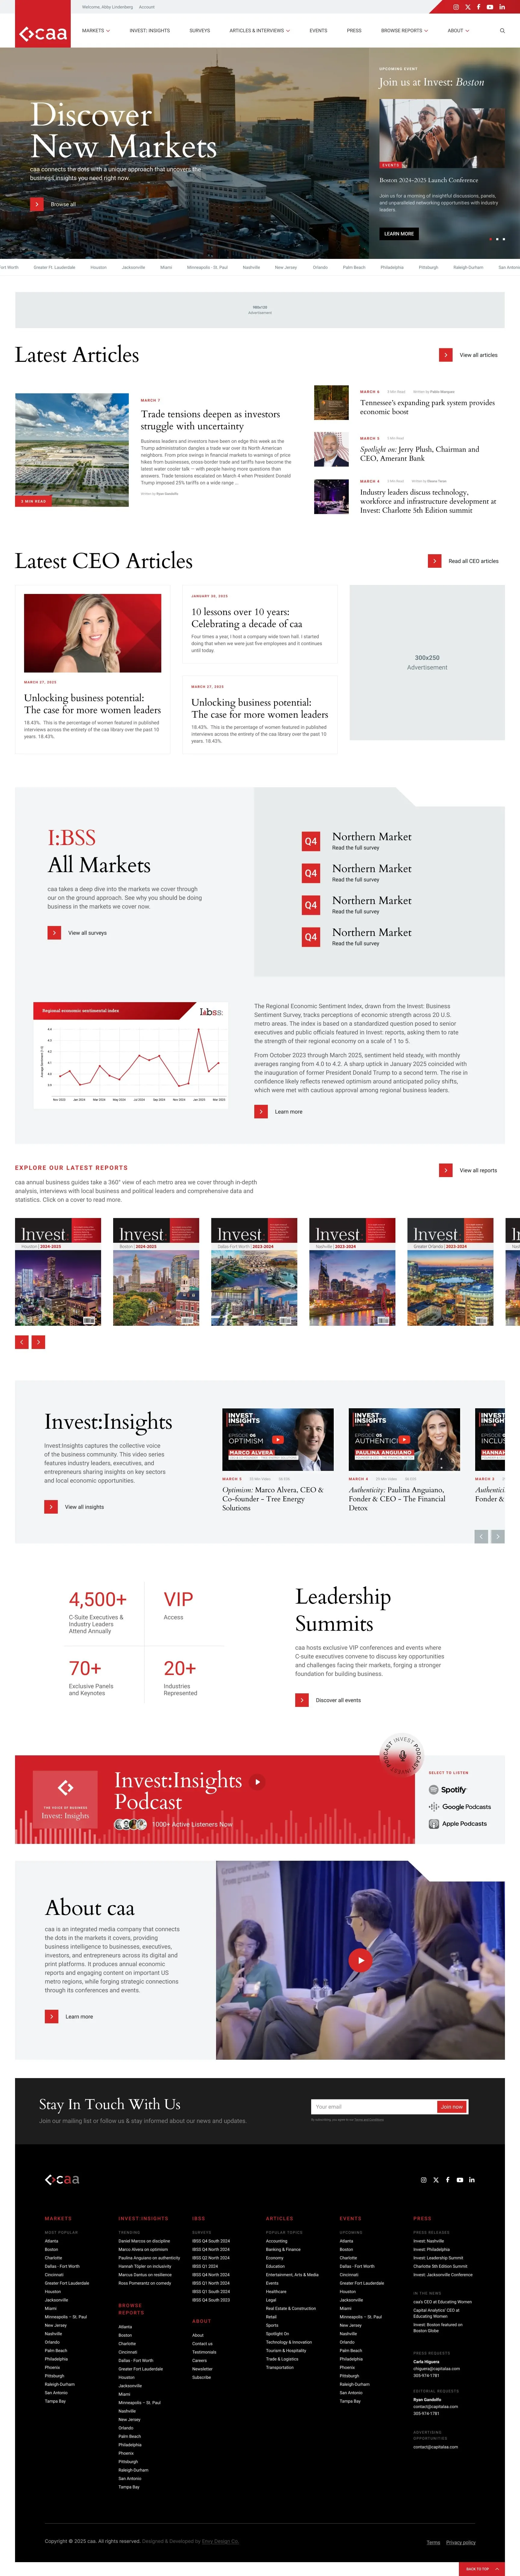
The homepage works like a front page. A rotating hero features the next launch event, a ticker of markets runs underneath, and the page moves through latest articles, CEO interviews, the sentiment survey, the report shelf, video and summits. It’s a good example of how visual hierarchy keeps a busy page calm.
03 — Design
Editorial type, red ink and room for ads
Capital Analytics already had a strong mark, a red block with a white chevron, so we built the design system around it. Headlines are set in a classic book serif that feels like a serious business publication, paired with a clean sans serif for navigation, dates and bylines. Red does the signposting: categories, arrows, event dates and calls to action.
Advertising and sponsorship pay for this kind of publishing, so ad placements were designed in from the start rather than squeezed in later. Leaderboards, in-feed units and sidebar slots are mapped across the templates, sized to standard formats and placed where they don’t interrupt reading.
04 — Markets and events
Where leaders meet and read
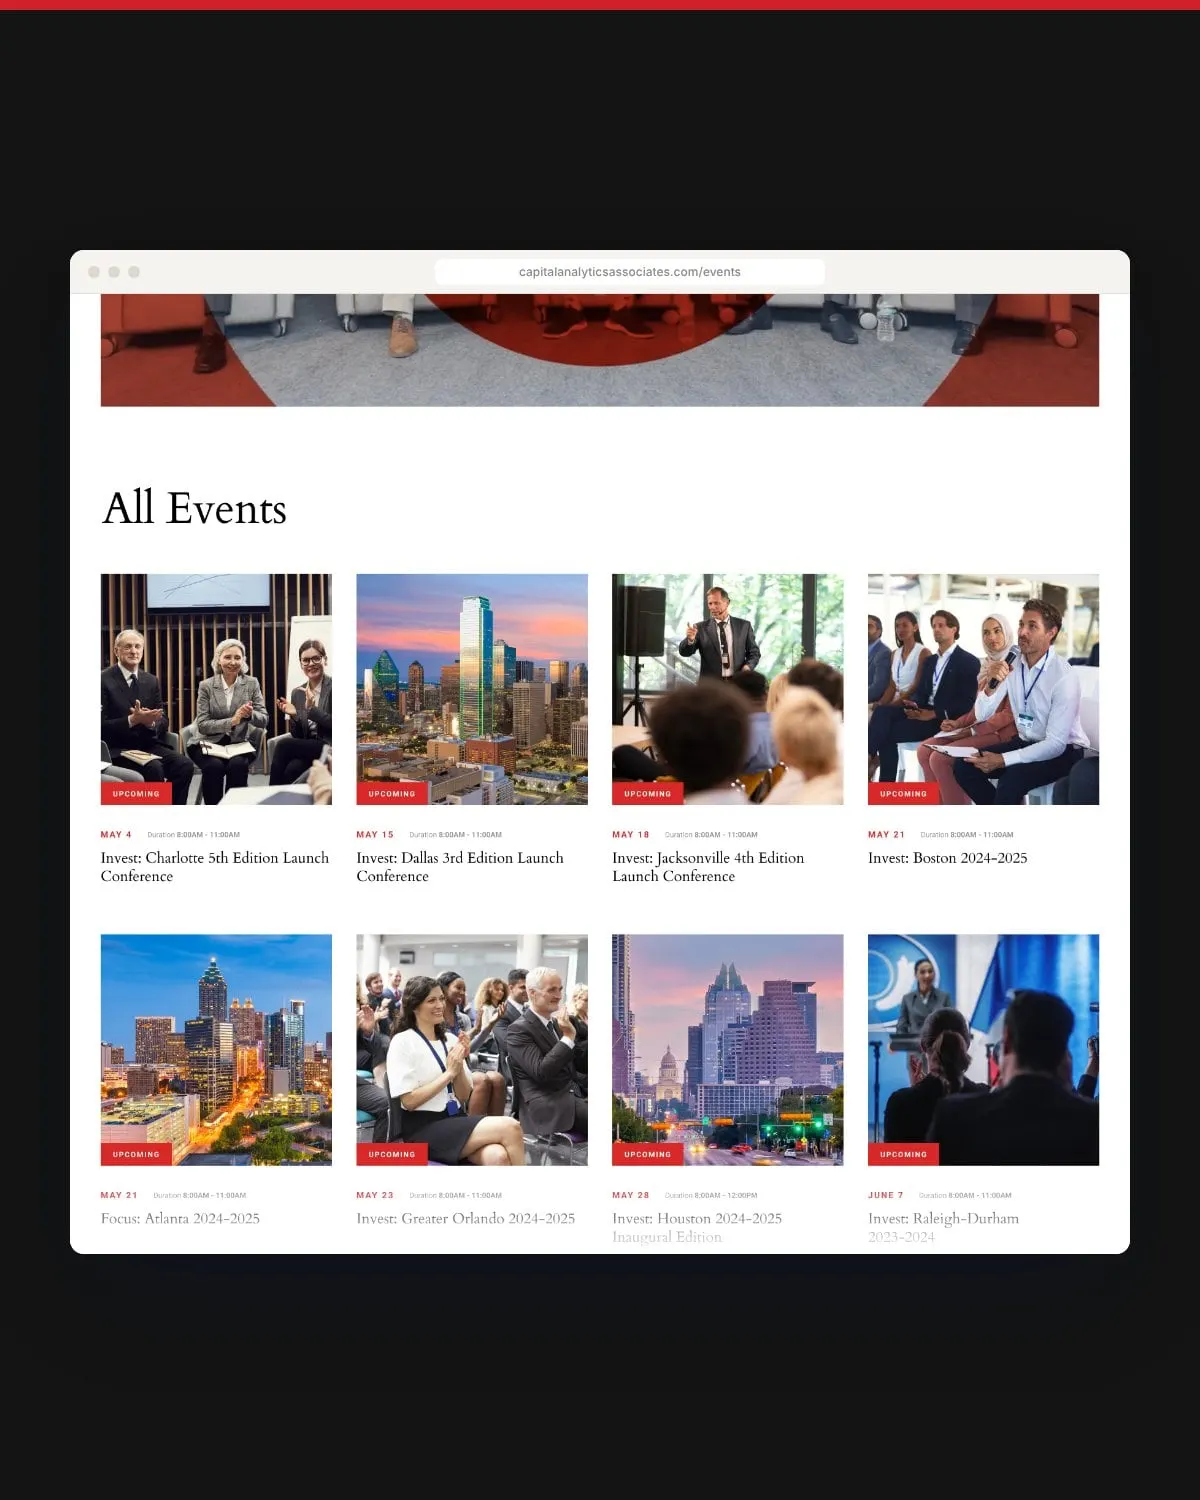
Each market page opens with a custom city banner and a short introduction to the local economy, then pulls together everything Capital Analytics publishes about that place. Events get the same treatment: an upcoming-events feature, a filterable list of launch conferences and summits, past events by date and related articles, with sold-out states and an event pop-up for quick details.
For more work with media and professional services brands, see our professional services projects, including Si Media.
05 — Reading and watching
Built for executives on the move
Most of Capital Analytics’ readers are senior executives, along with investors and public officials, so every template has to work as well on a phone at a conference as on a desk. Article templates come in several versions, with and without author profiles, alongside CEO interviews, press releases and in-the-news pages. Invest: Insights has its own video library with filters by market and category, and the podcast is one tap away on Spotify, Google Podcasts and Apple Podcasts.
We designed and developed the site so the editorial team can publish every week without a developer. If you’re weighing a rebuild, our website redesign checklist is a good place to start.
On the road
From the boardroom to the ballroom
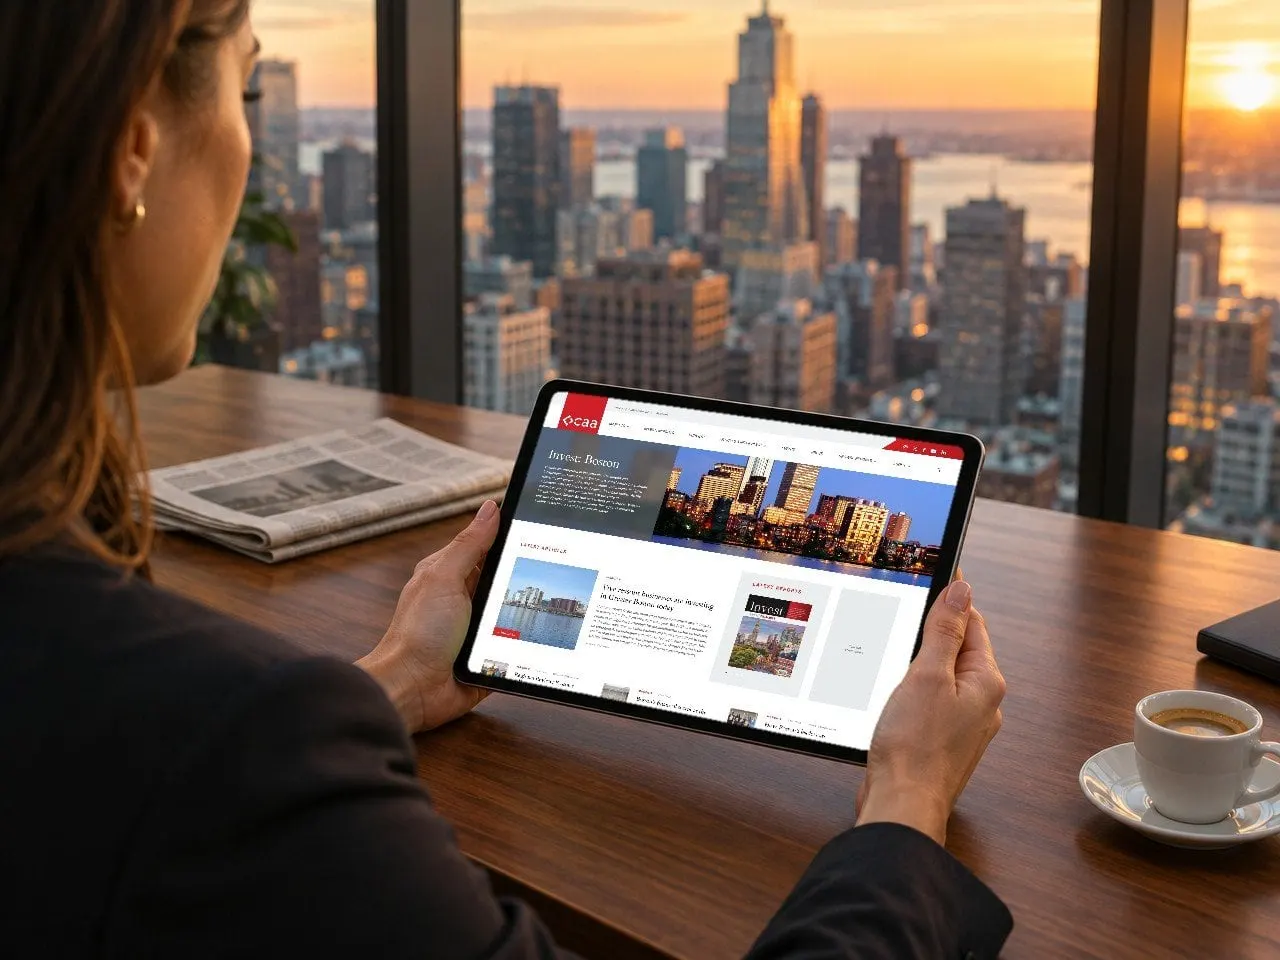
The same pages that sell sponsorships also brief attendees on the morning of a launch conference.

What we delivered
A redesigned website for a U.S. business media and economic research platform.
- 01Website designThirty page designs covering reports, twenty markets, events, articles, surveys, video, press and careers.
- 02UX and UI designFour mega menus, market pages, an ad-ready layout system, filters, pop-ups and a full component library.
- 03Website developmentA site the editorial team can update weekly with new articles, reports and events.