Infographics
Complex ideas, made simple.
Infographics, charts and diagrams that turn data and processes into clear, accurate visuals people understand at a glance.
The best infographic does the reading for you. One look and the point lands. Getting there takes more than nice icons: it takes understanding the data, choosing what matters and designing it honestly.
What is an infographic?
Data you can see.
An infographic is a visual explanation: charts, diagrams, icons and short text combined to make data, processes or ideas easy to understand. Infographics work in reports, presentations, websites, social posts and printed materials.
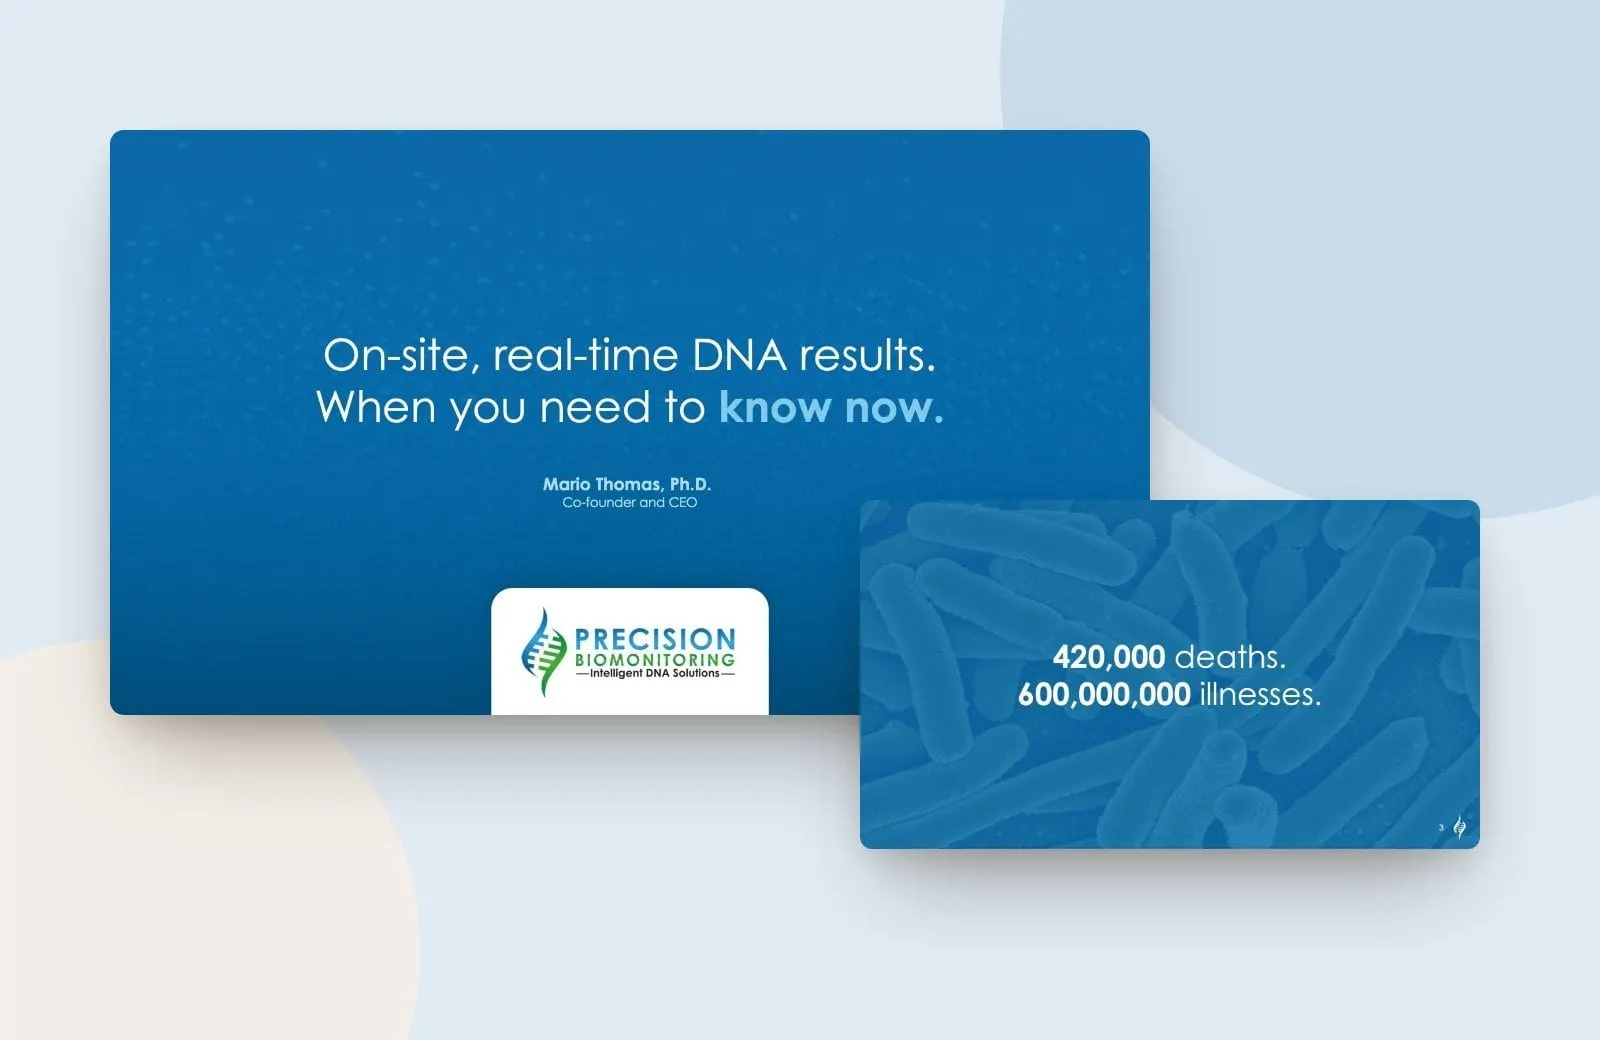
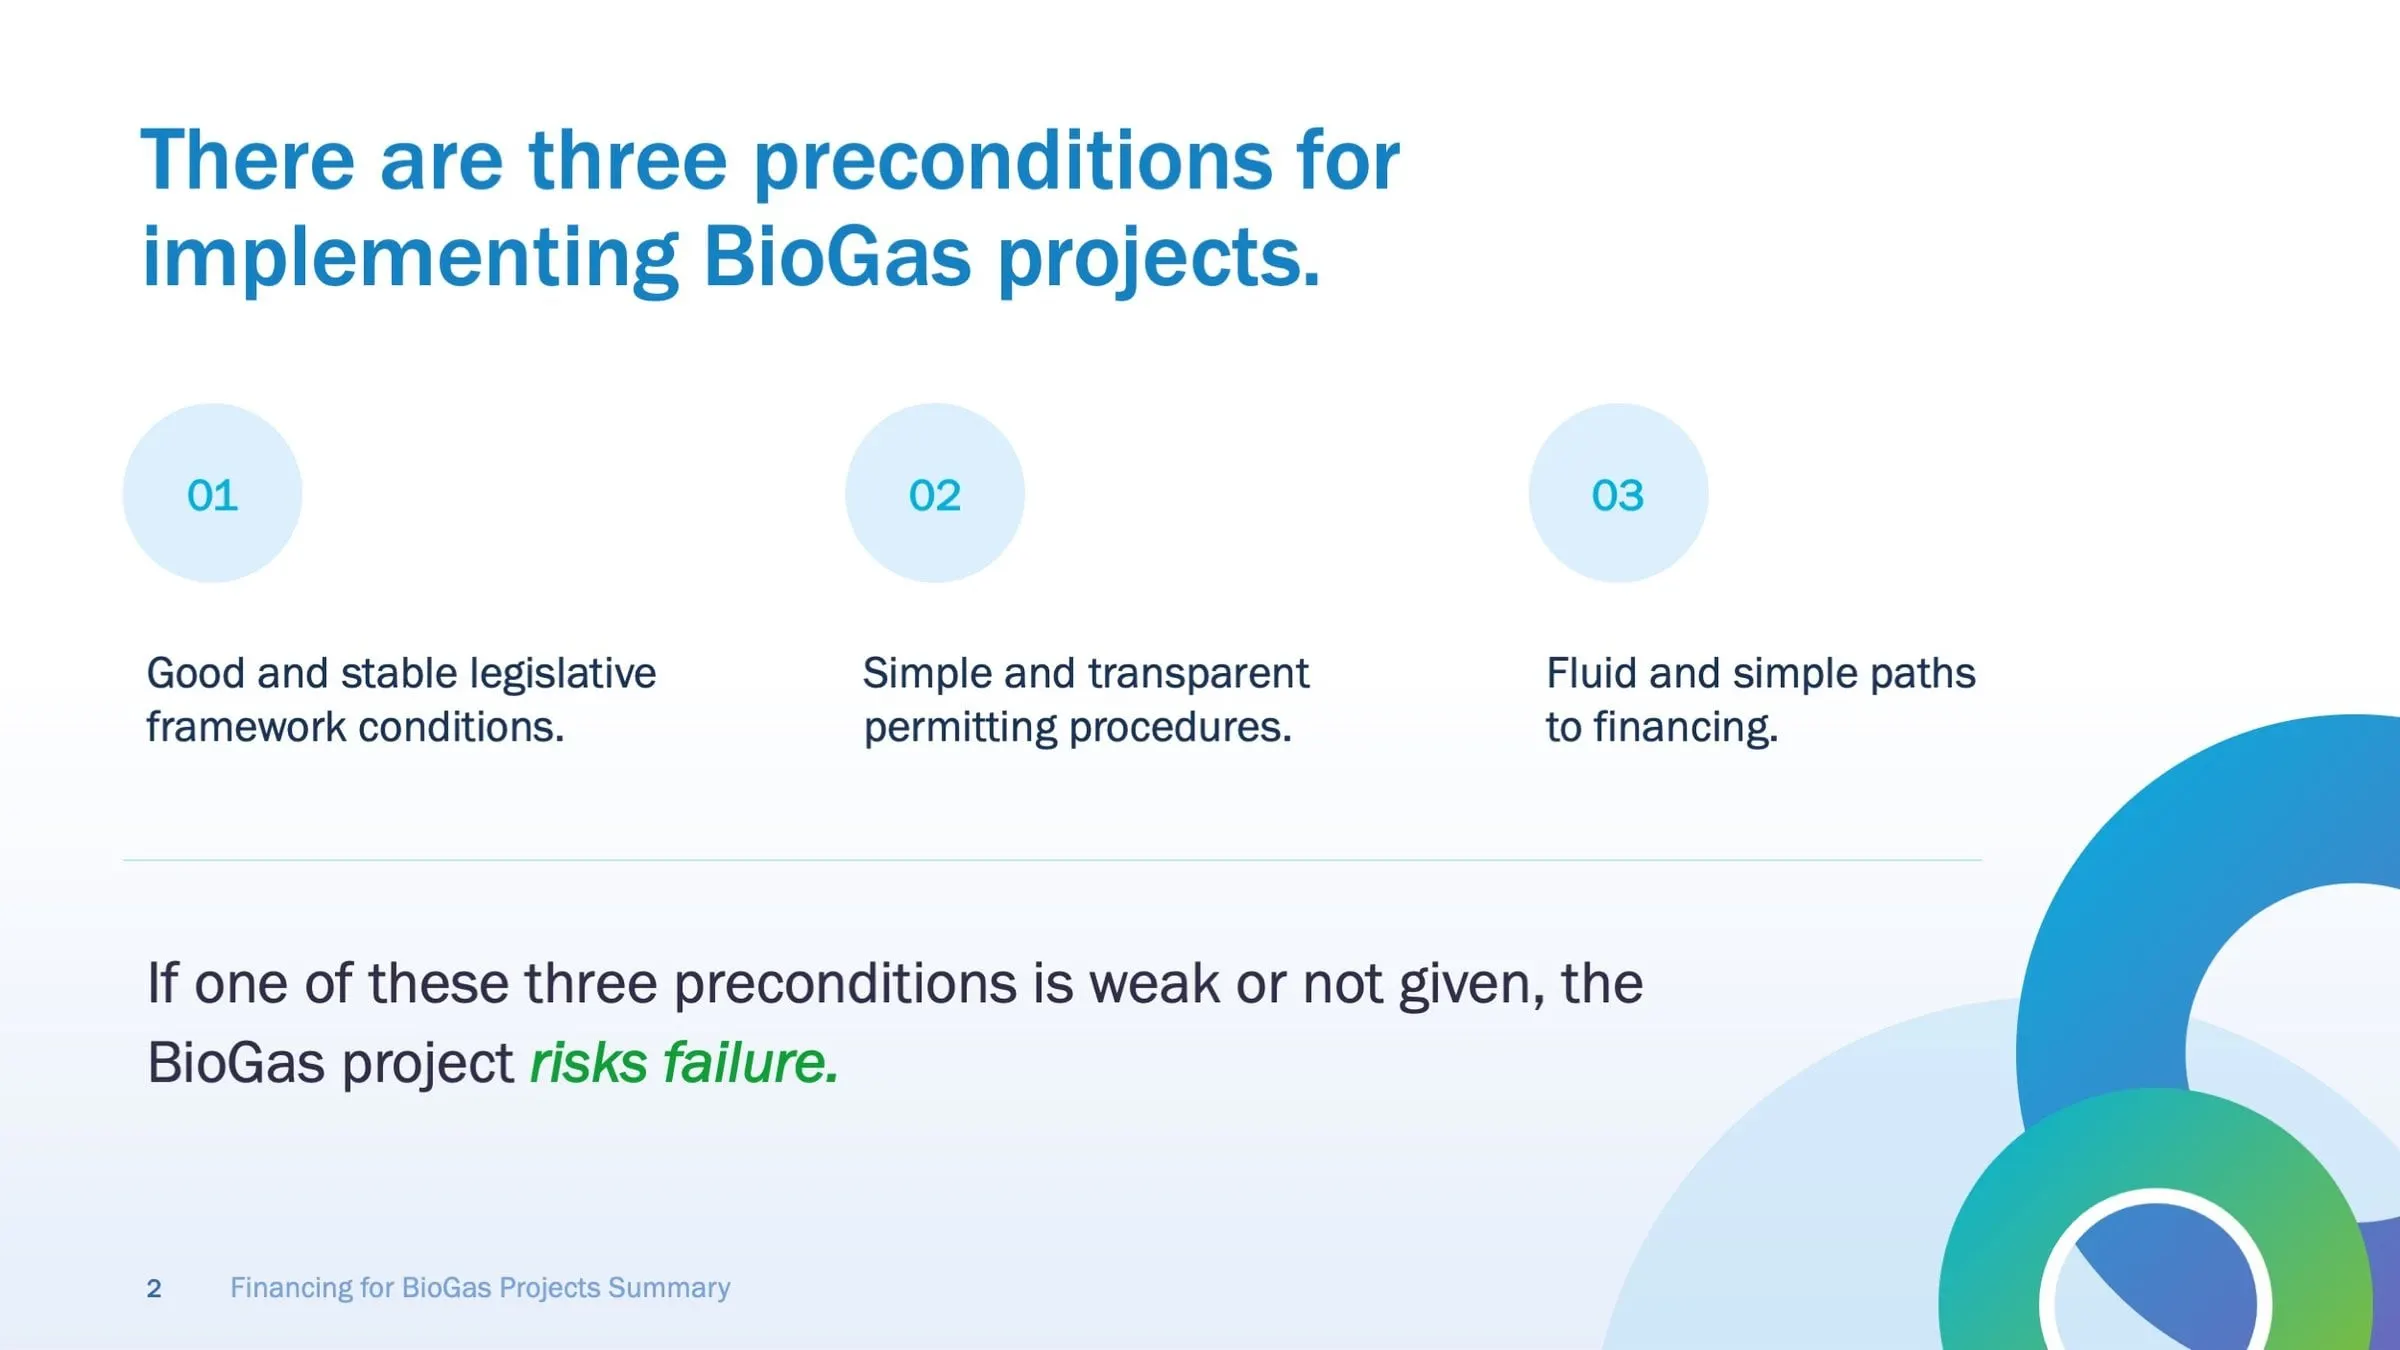
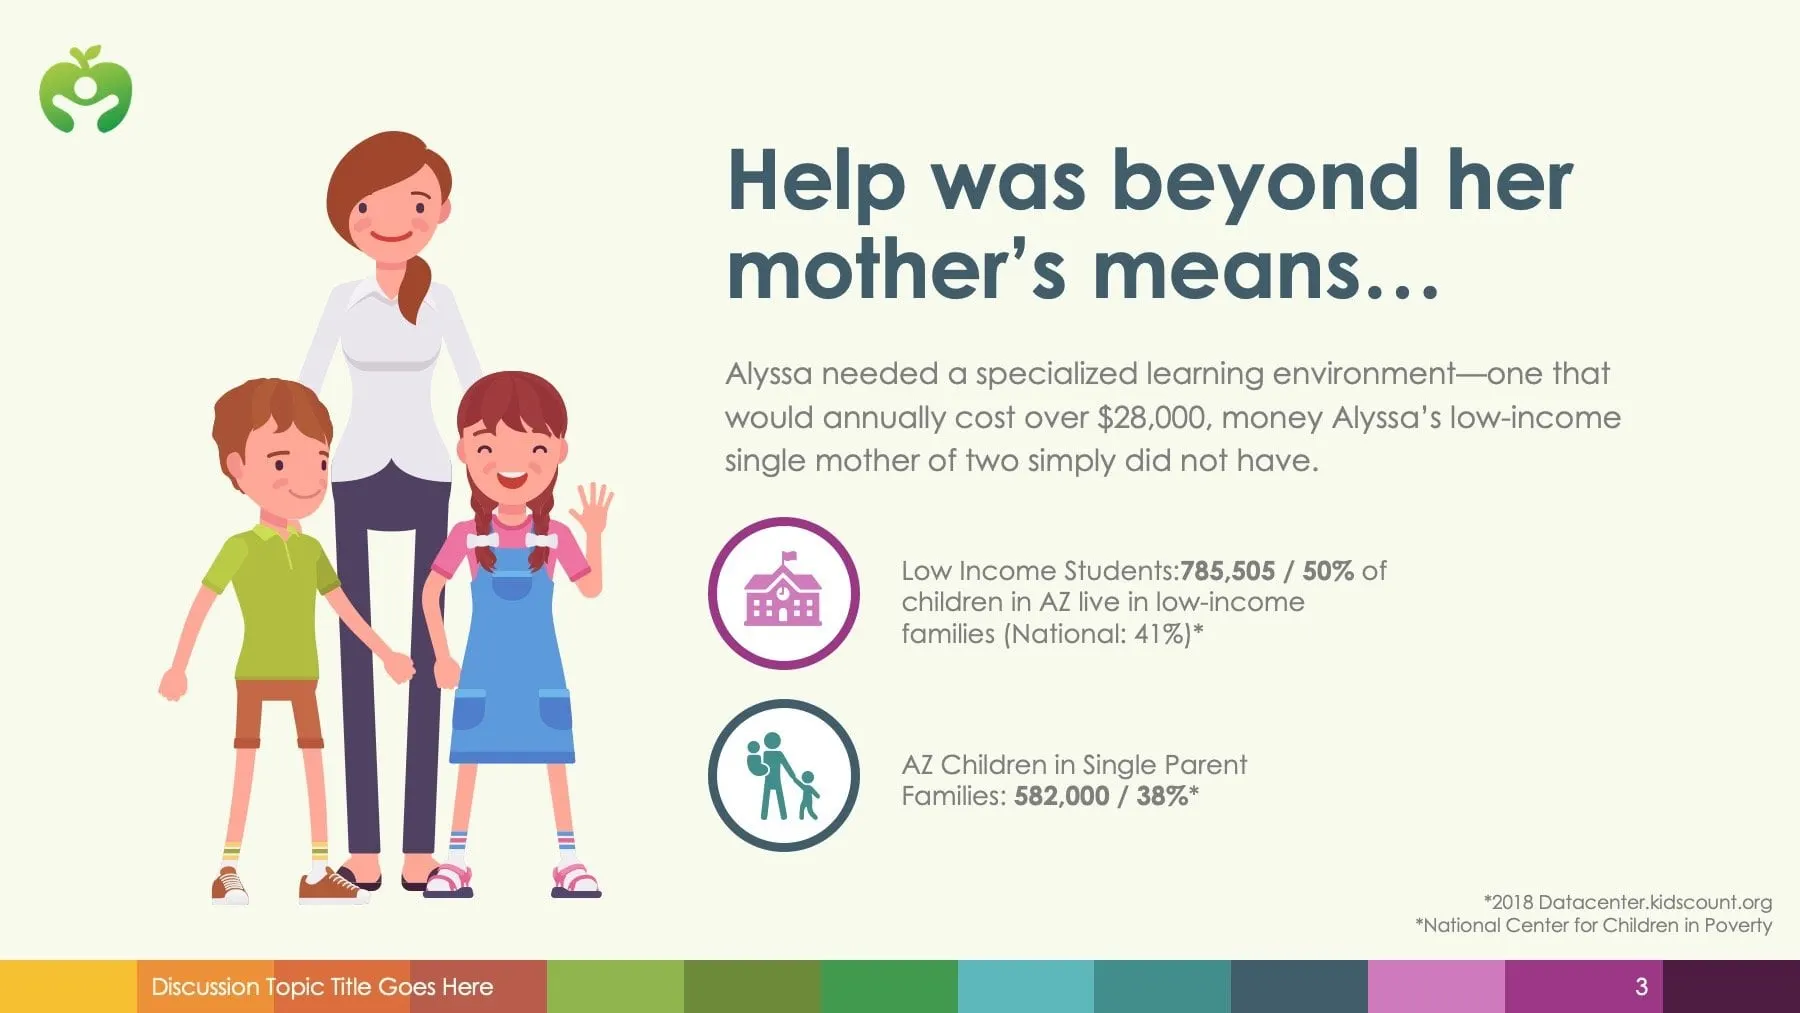
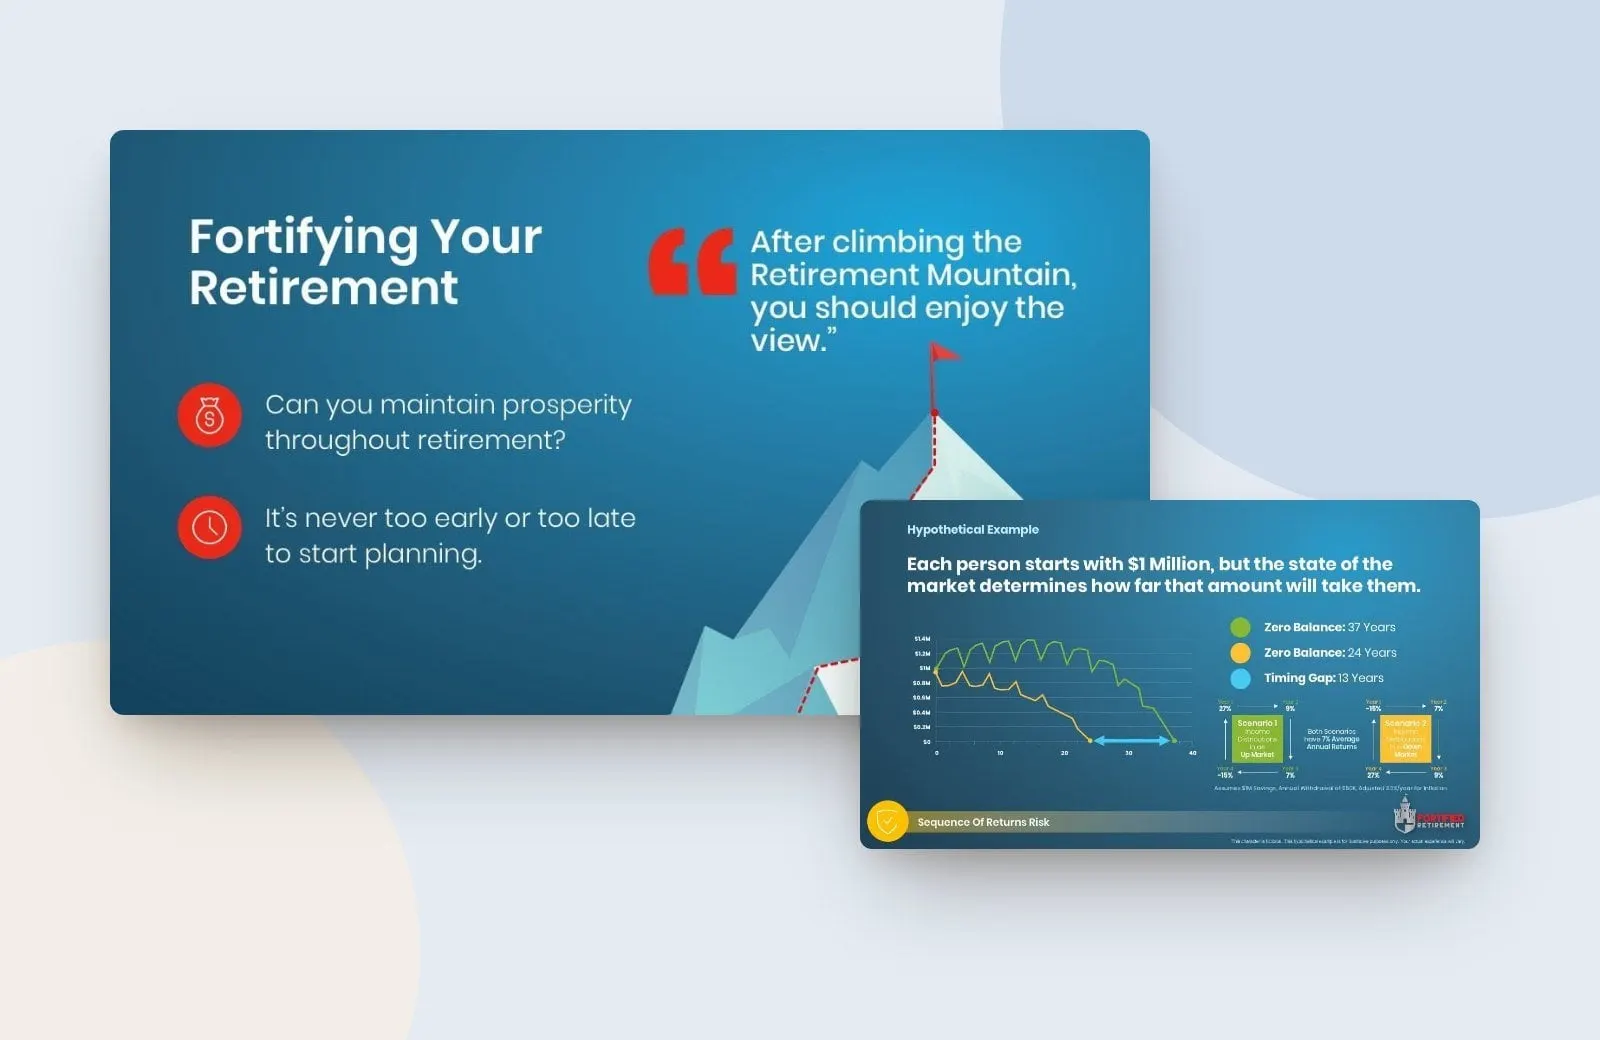
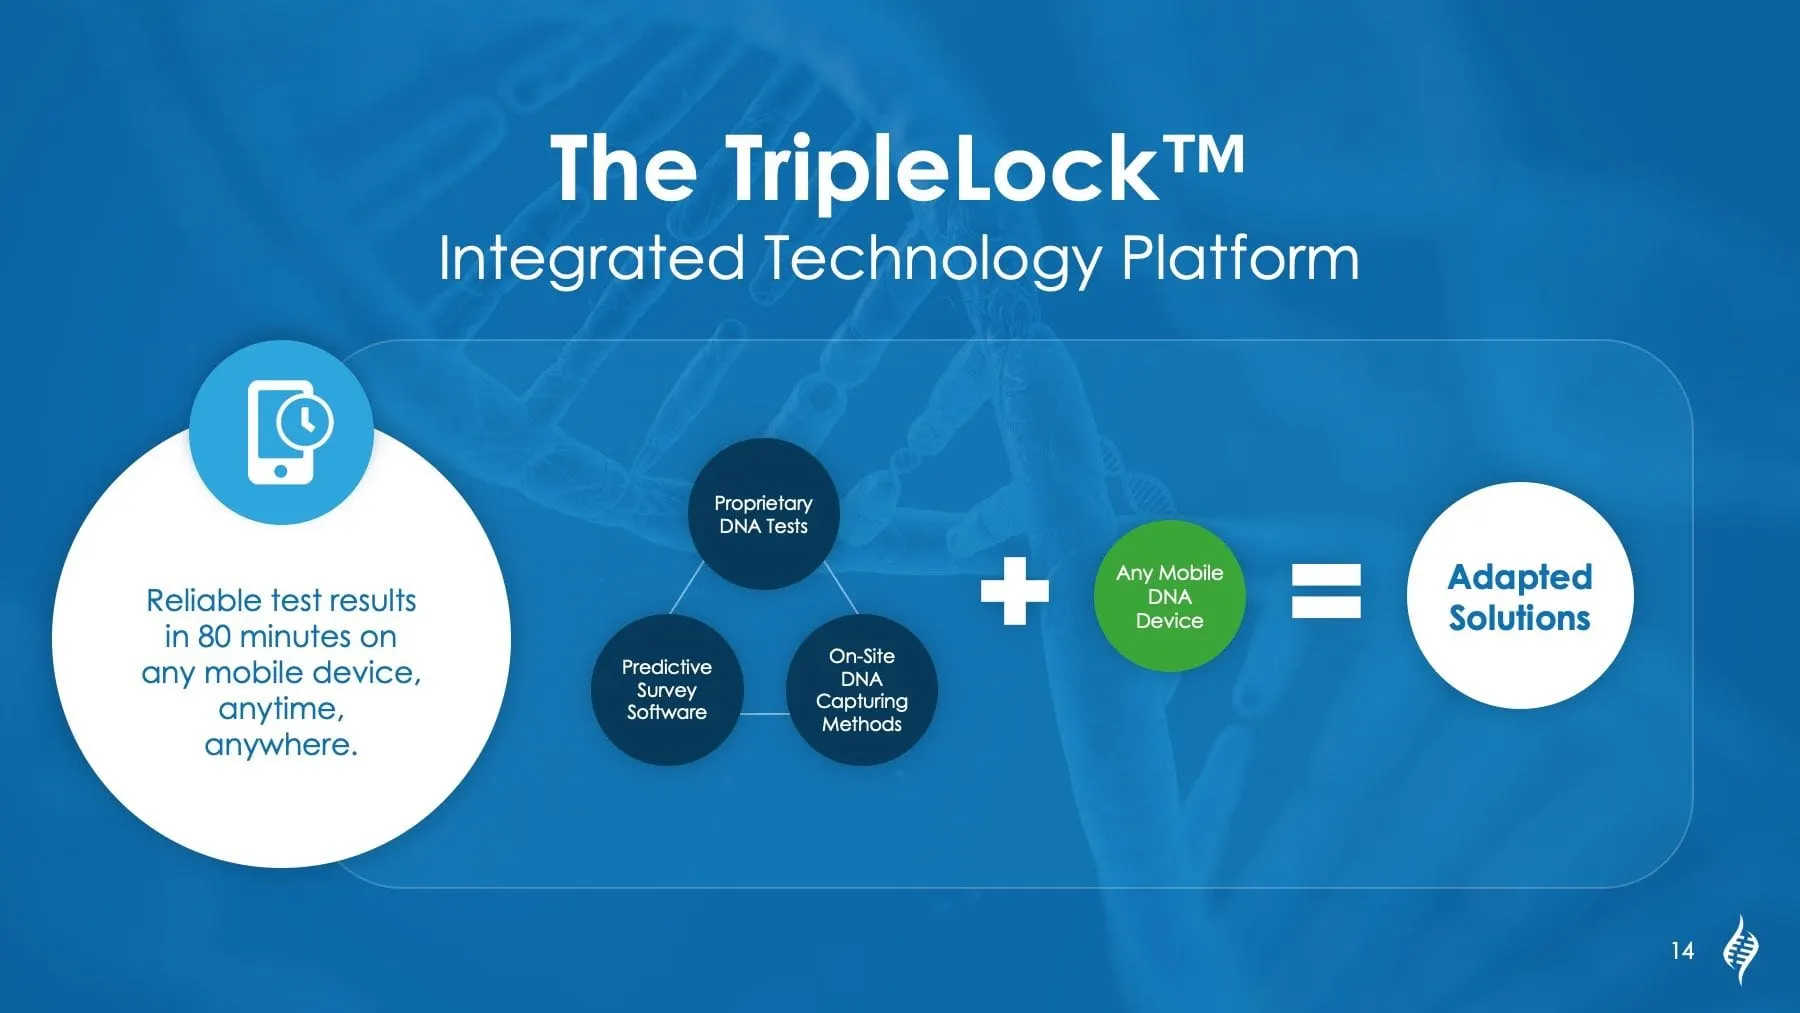
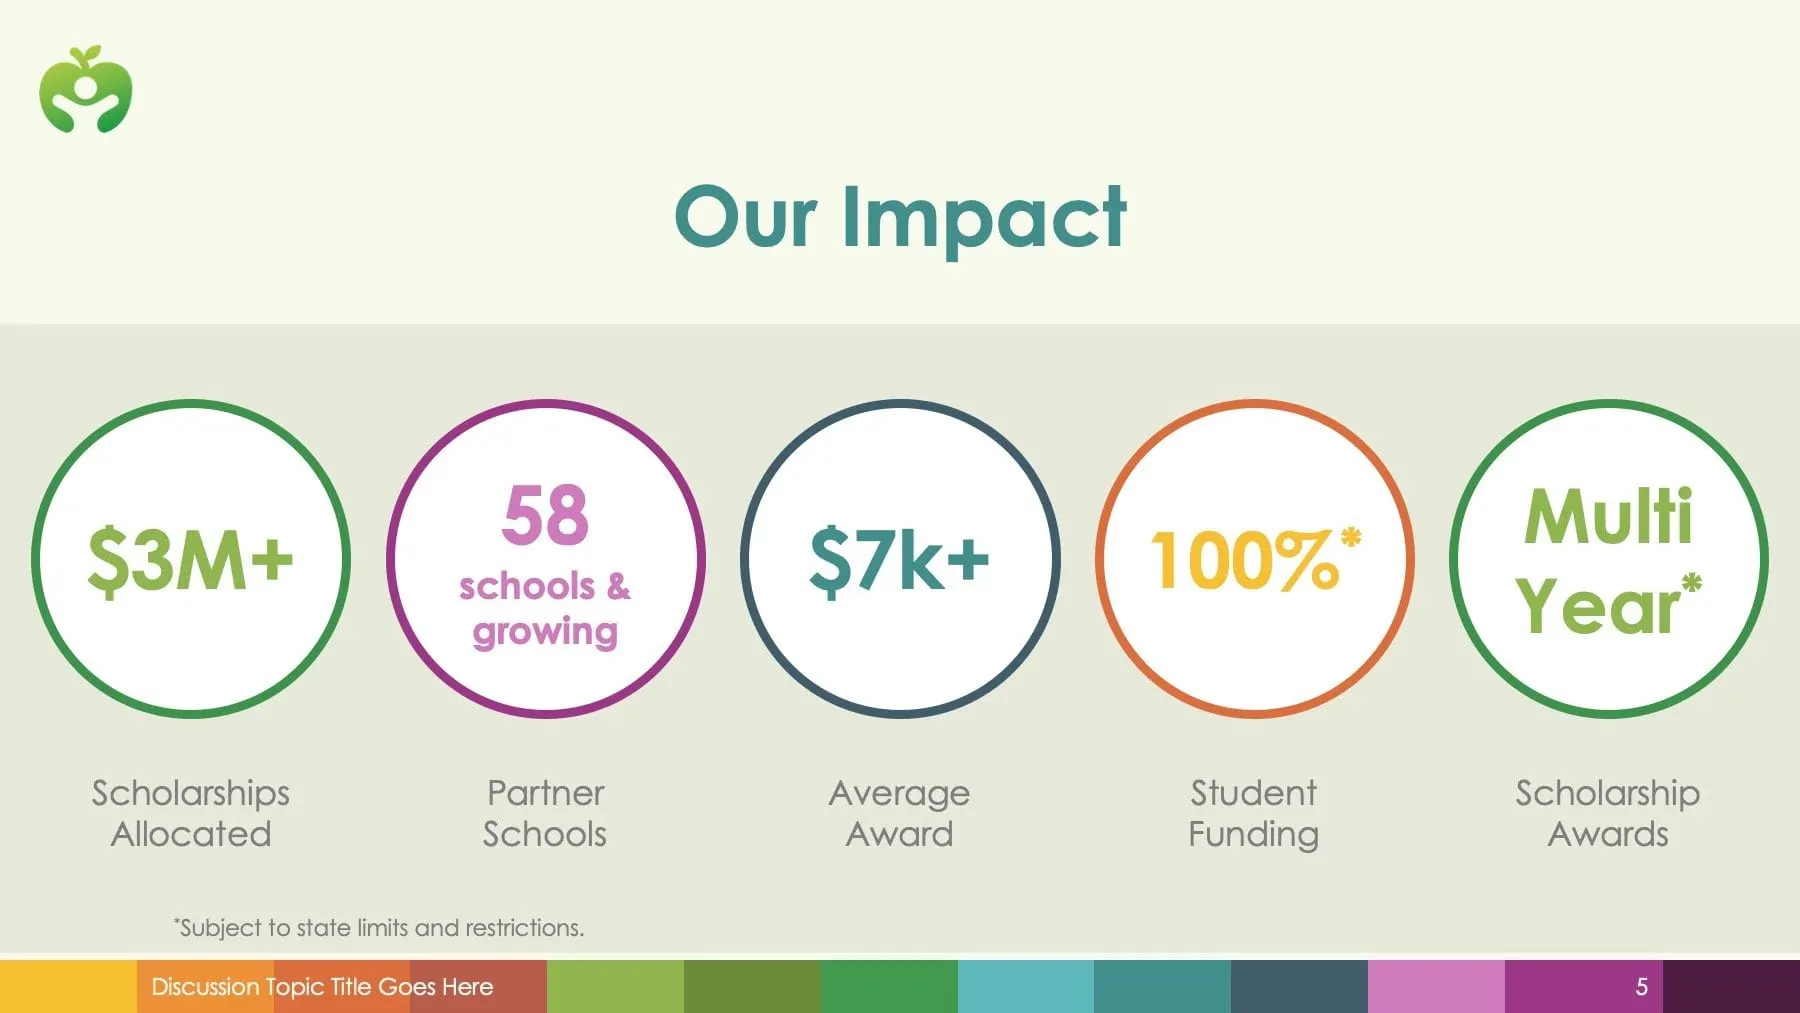
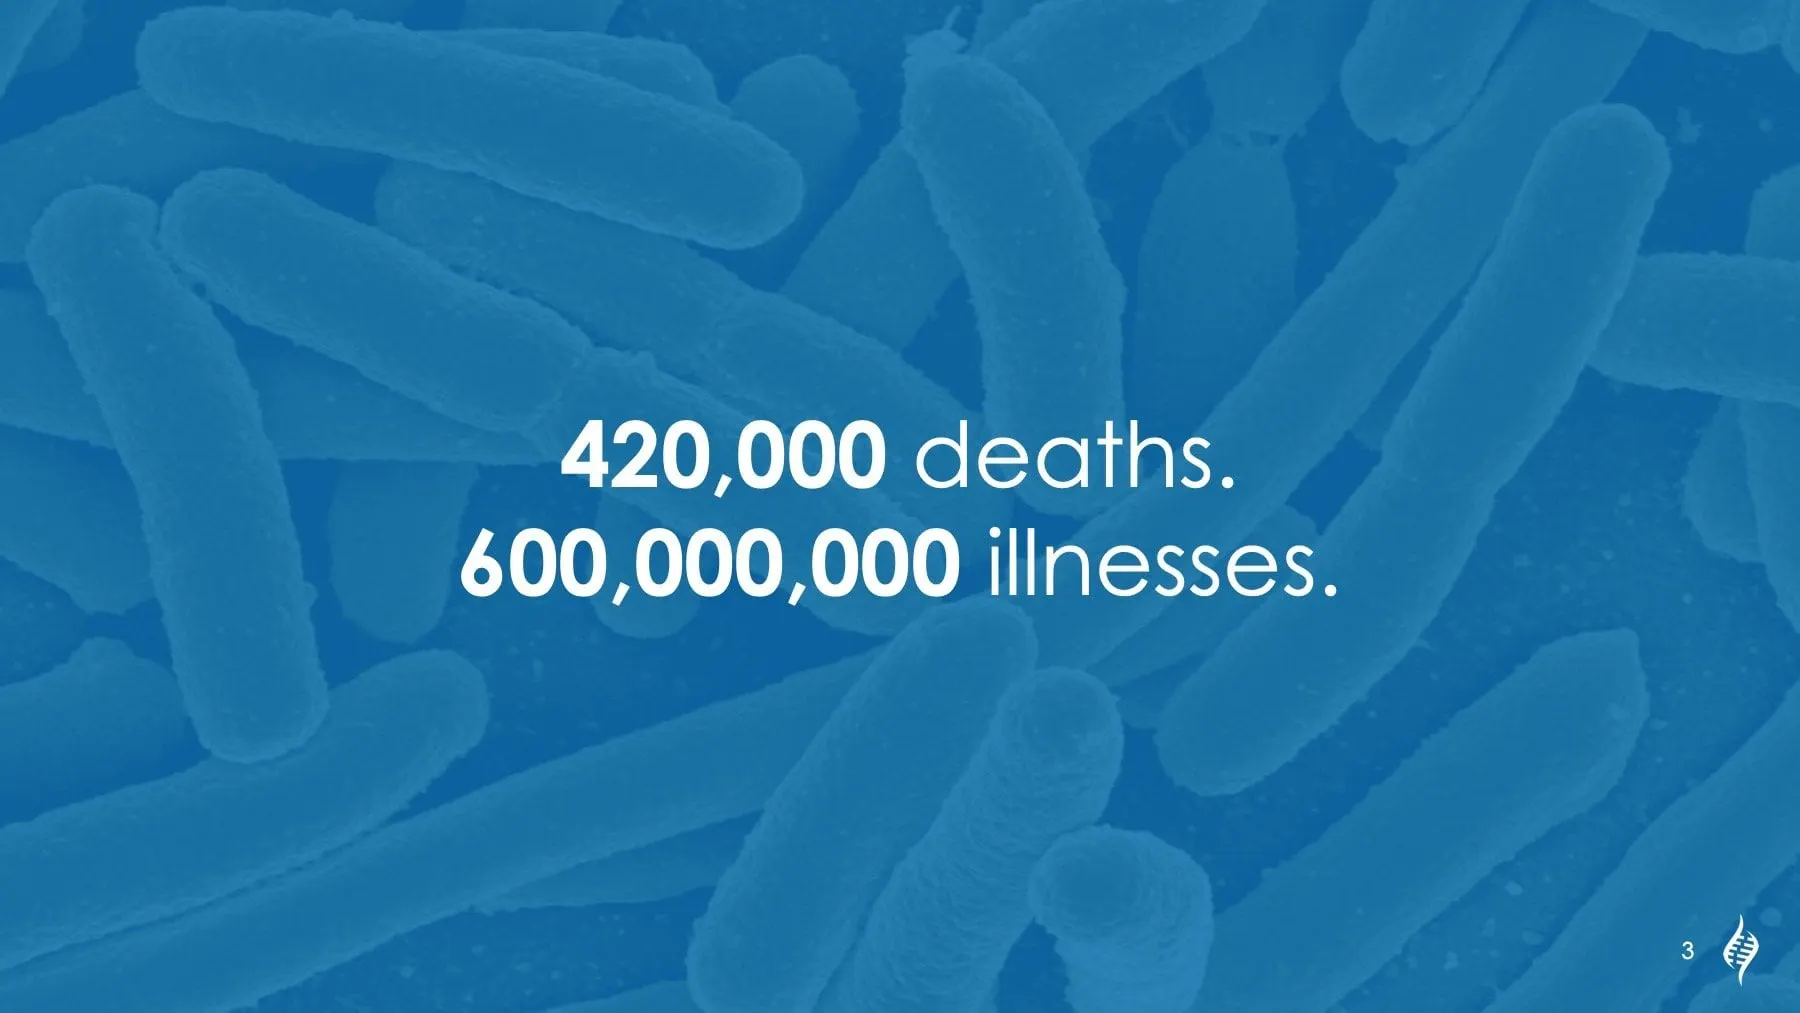
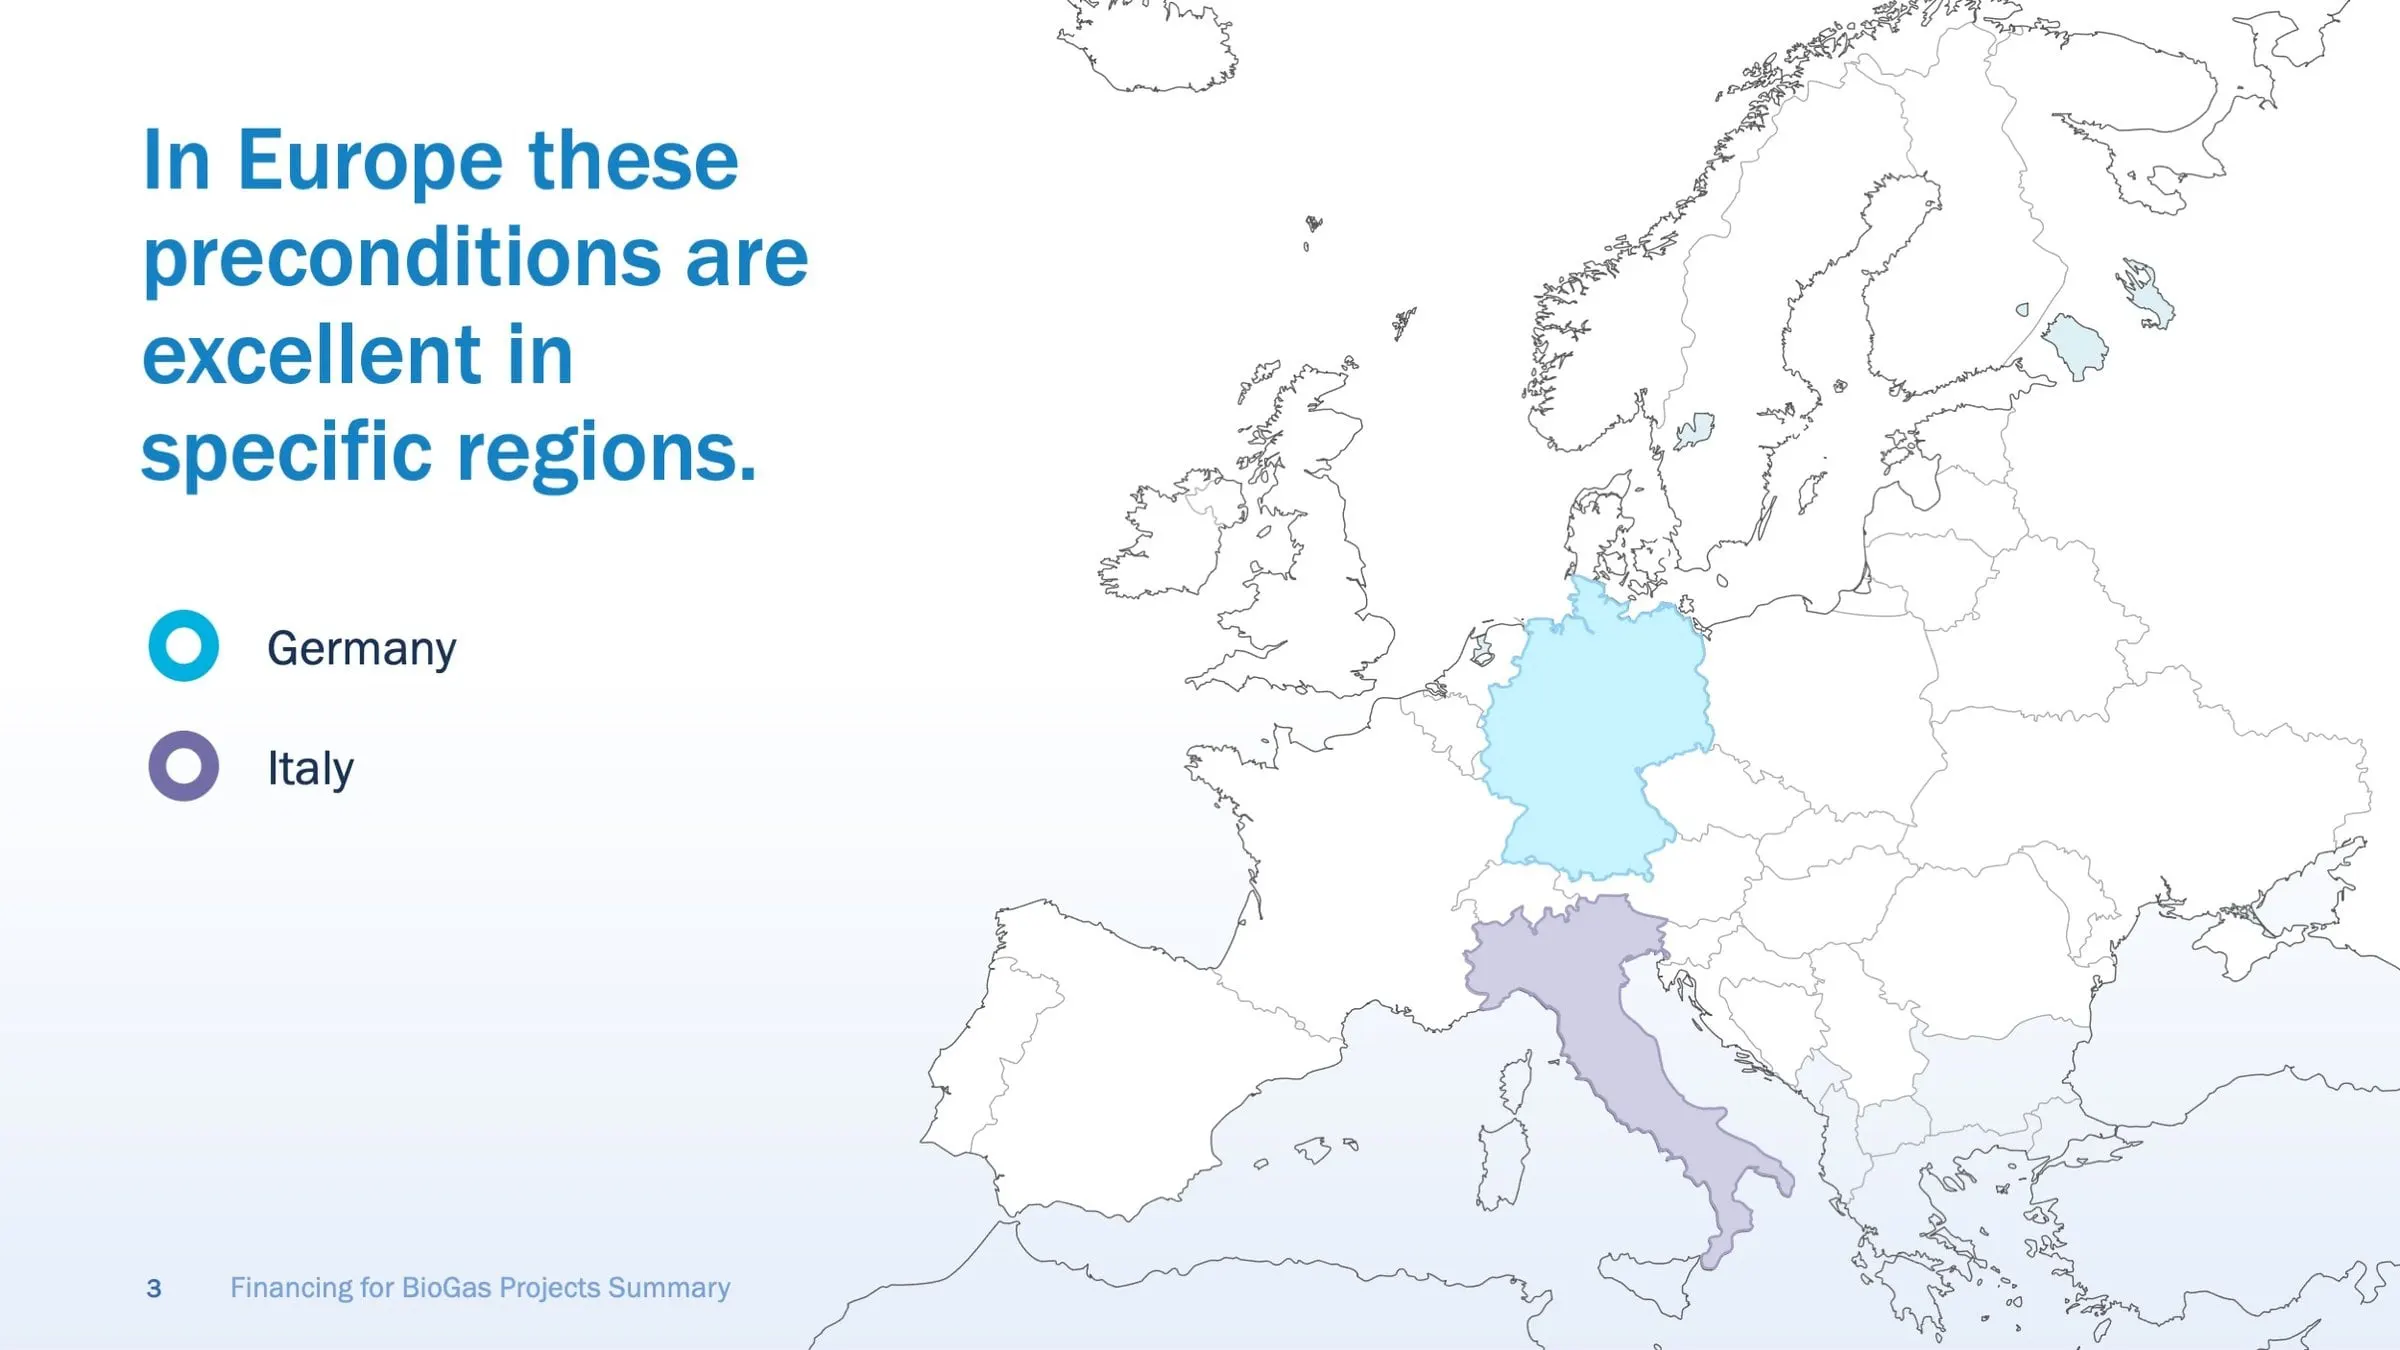
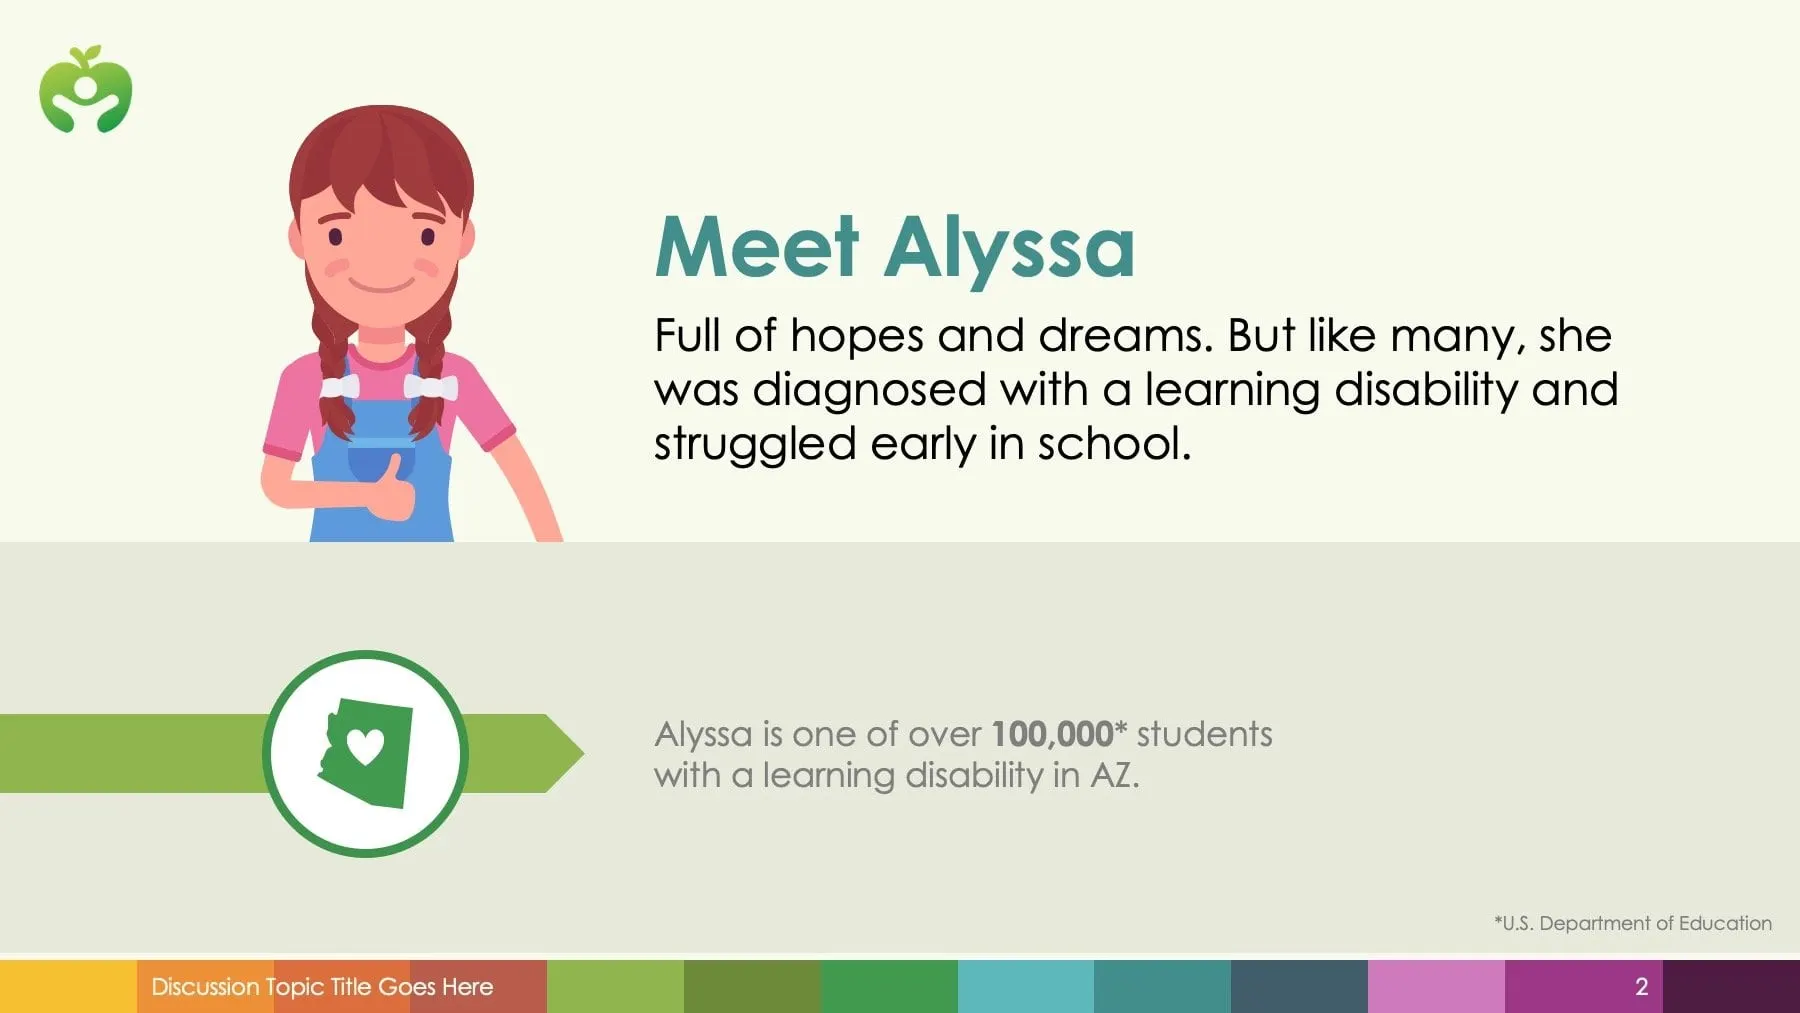
We have designed infographics for science and technology companies like Precision Biomonitoring, energy financing decks for BioGas, impact slides for Academic Opportunity of Arizona and retirement planning for Fortified Retirement.
Infographics often live inside presentations and annual reports.
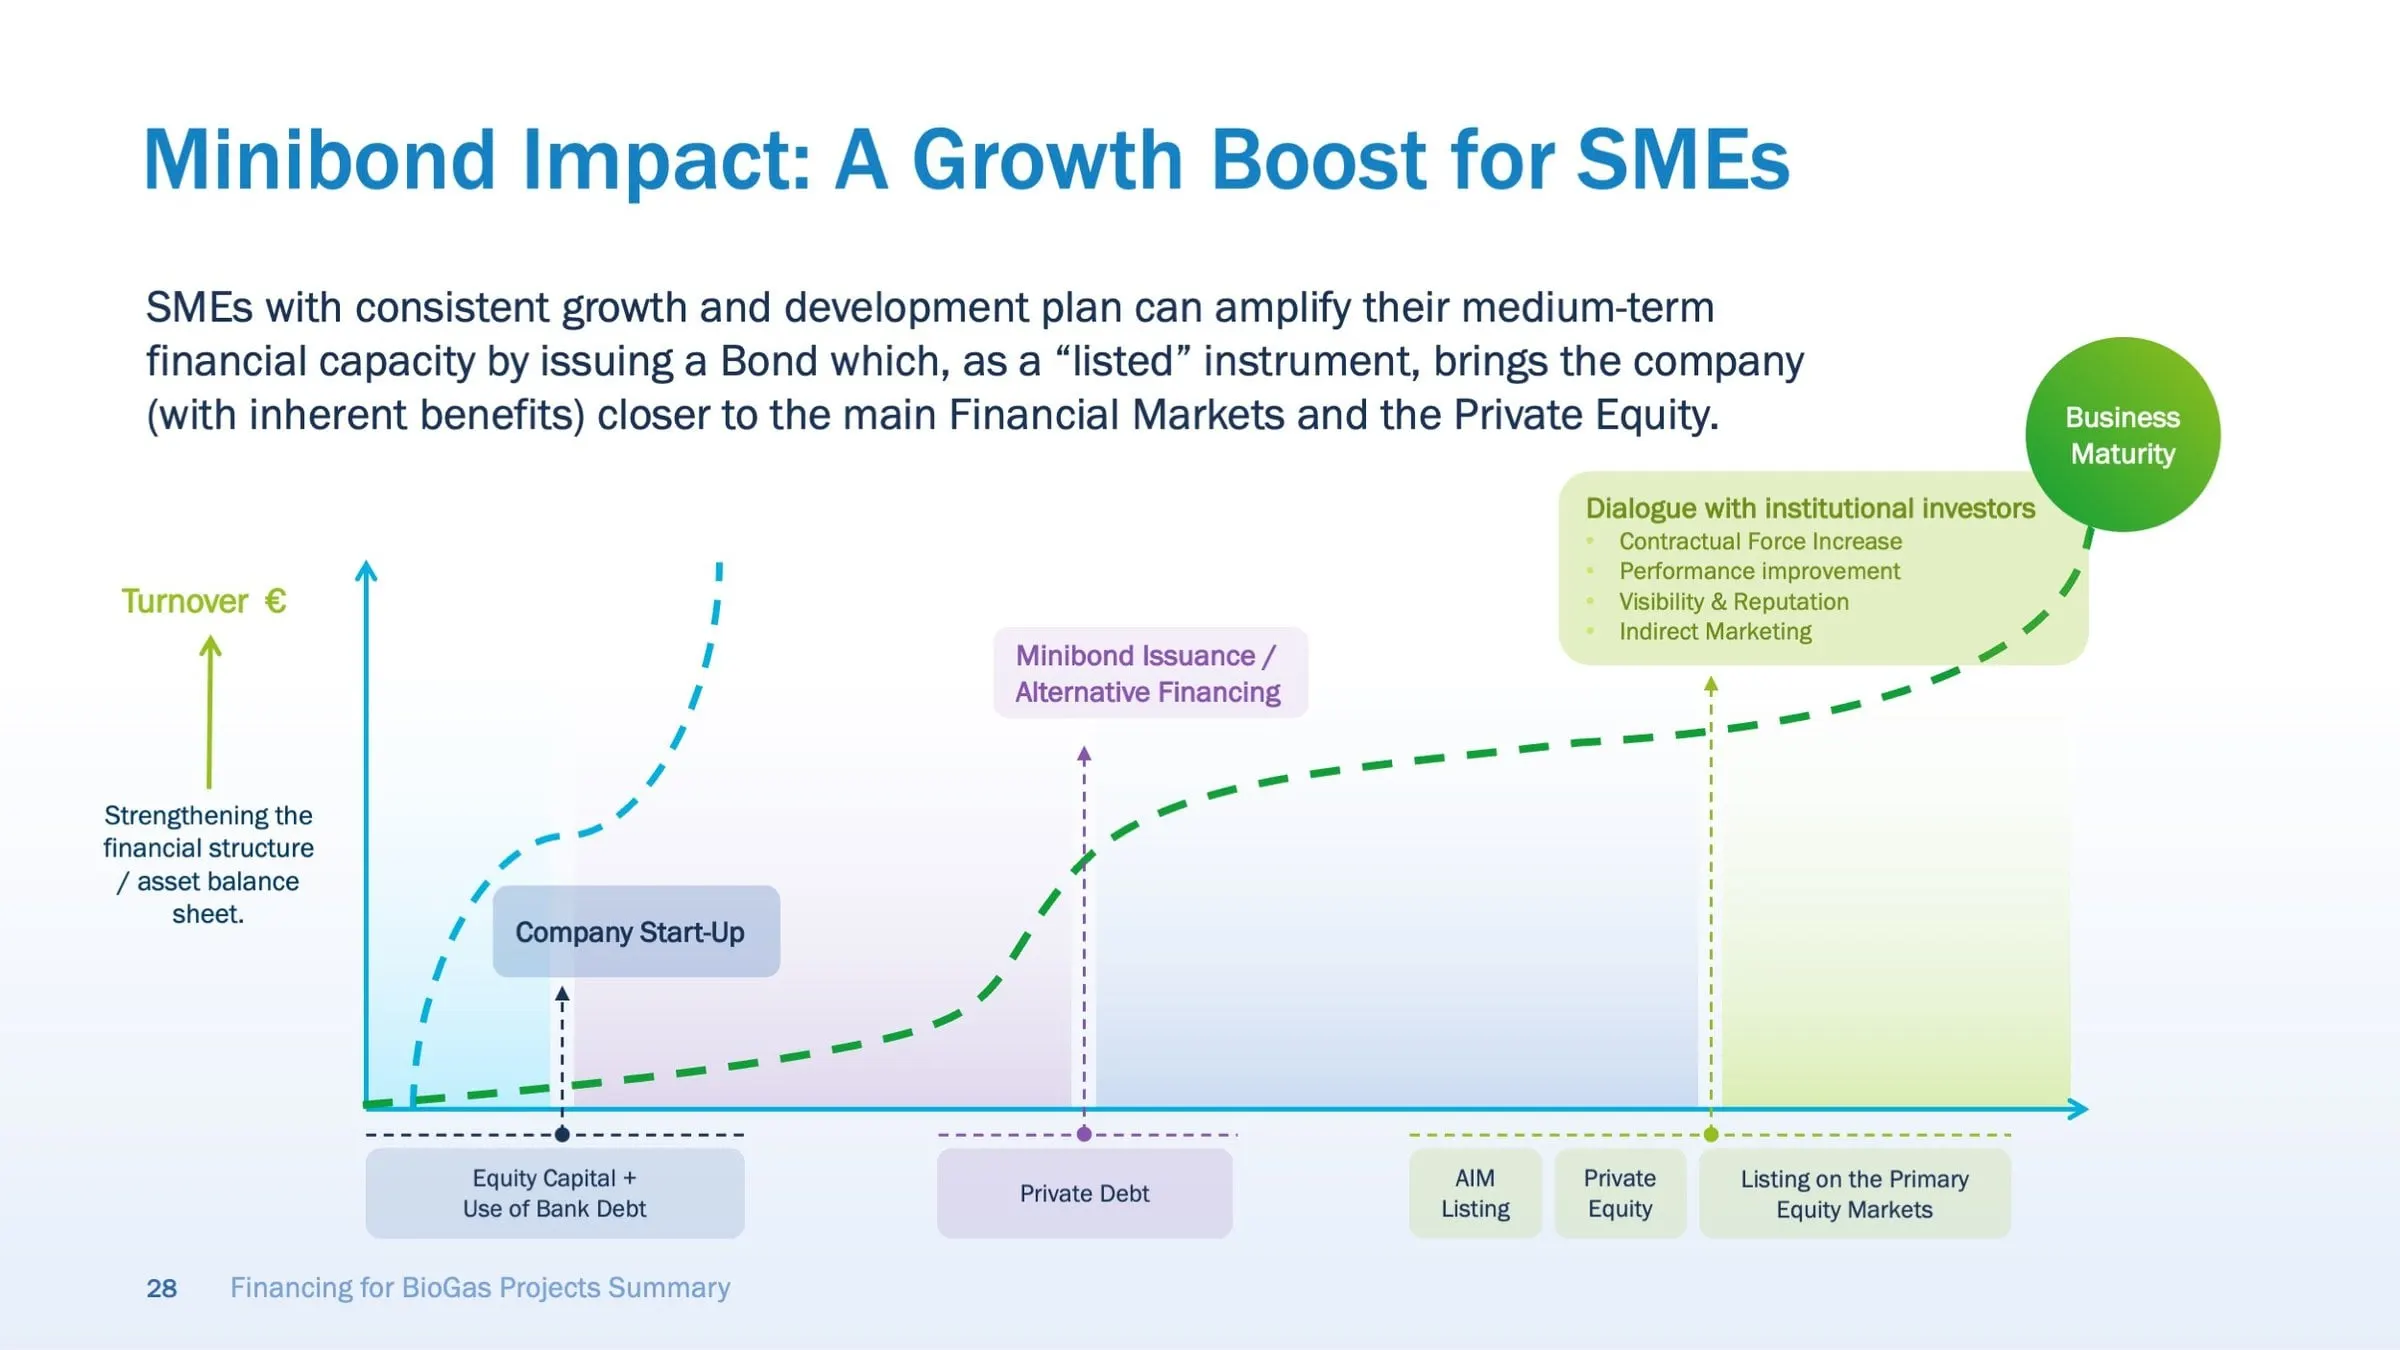
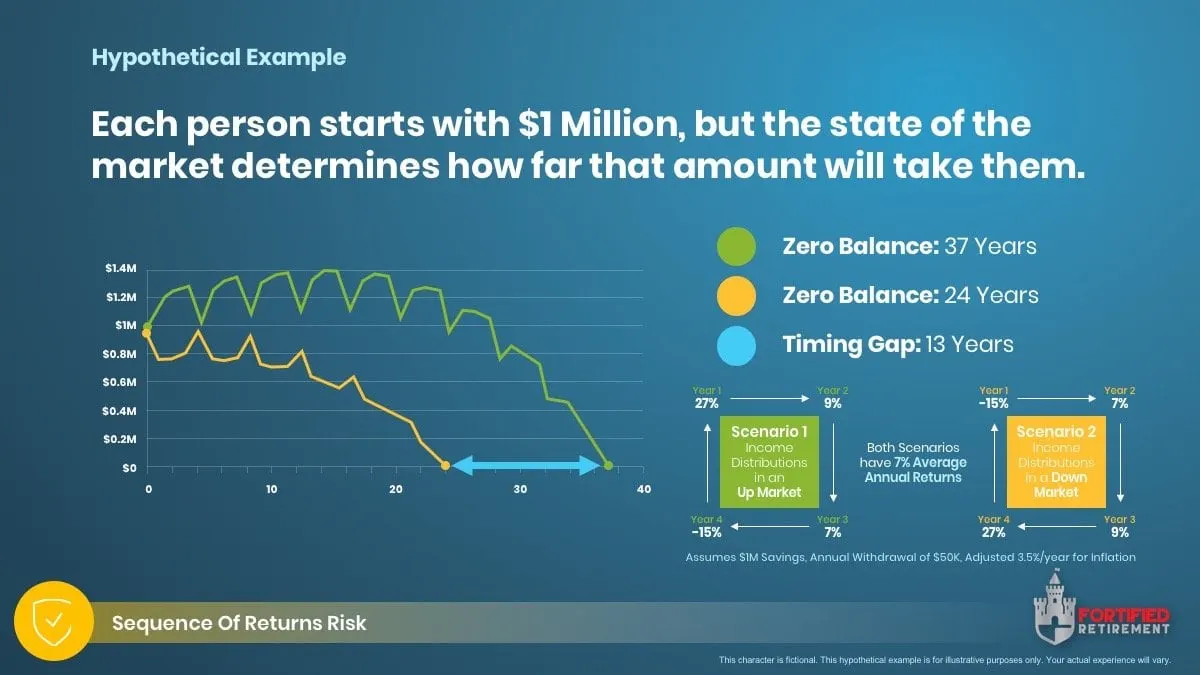
What we design.
For print, screen and social.
Got data that needs a story?
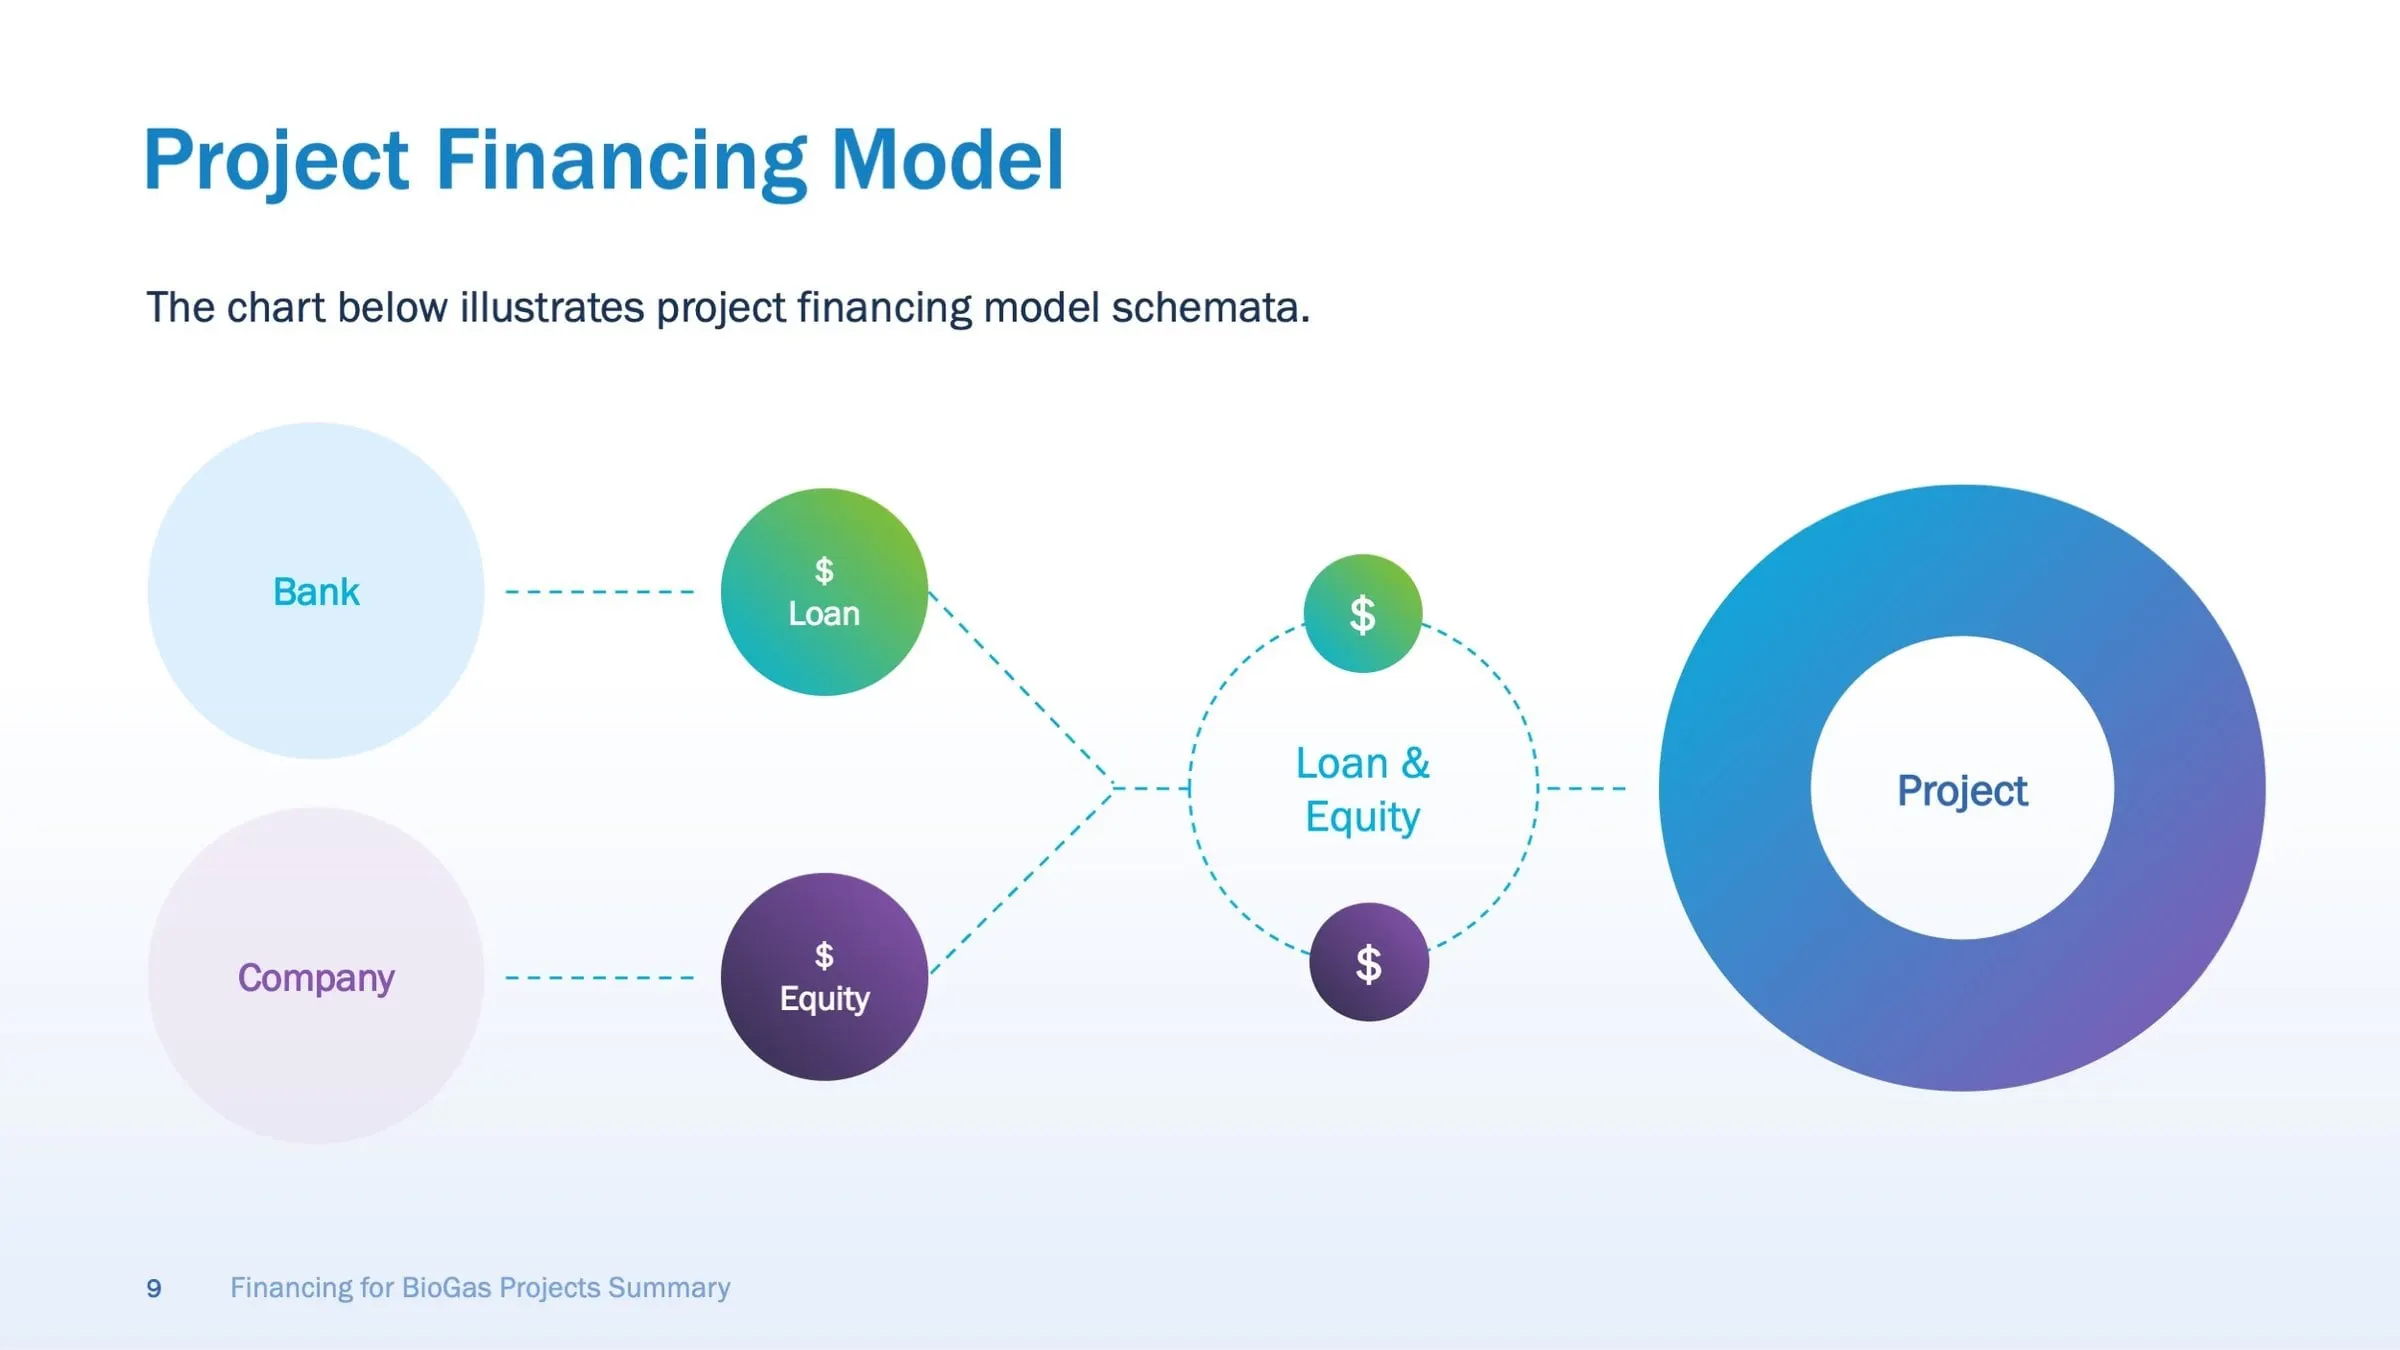
How we make data clear.
Understand first, then design.
-
01Understand
Data & Message
We review your data and agree on the one point each graphic must make. Good infographics simplify complex information, so it’s important to know exactly what readers should walk away with.
We’ll ask questions, confirm sources and pick out the most telling facts. That focus guides the structure and helps the final design tell a clear, accurate story instead of trying to say everything at once.
-
02Sketch
Structure
We sketch the structure and choose the right chart or diagram for the information. Bar charts, timelines, maps and flowcharts each suit different kinds of data, and the wrong choice can muddy even a simple point.
Sketching first lets us test layout and flow before any detail goes in. Once the structure works, we can design an infographic that’s both accurate and easy to understand.
-
03Design
Design
We design the final graphic in your brand style, using colour, icons and typography to make the information clear and engaging. Visual hierarchy guides readers through the story one step at a time.
You review the design with us, and we refine the details until it’s ready. The result is an infographic that makes its point quickly and looks right at home alongside the rest of your brand.
-
04Deliver
Files
Files for print, web, presentations and social. Each version is sized and optimized for where it will appear, from a printed report to a slide deck to a social media post.
You get organized, ready-to-use files, so your infographic can earn its keep across every channel. All that careful data work finally gets the attention it deserves, wherever your audience happens to see it.

Clear, honest and on brand.
Good infographics are accurate first, beautiful second, and we do both. We work from your data, processes or research to find the one point that matters, then design charts, diagrams and icons that make it clear at a glance and look at home with the rest of your brand.
Accuracy first
We never distort data for drama. Scales, proportions and labels are checked carefully, so your graphics hold up to scrutiny from clients, boards and the press.
One clear point
Every graphic has a job. We decide what the reader should take away before designing, which keeps each visual focused and easy to understand in seconds.
Brand-consistent
Charts and icons are drawn in your style. A consistent visual language makes your reports, presentations and posts look connected and instantly recognizable as yours.
Every format
Print, slides, web and social. We size and adapt each graphic for where it will appear, so it stays sharp and readable on a page, a screen or a phone.
We’ve earned some good company. Recognize anyone?










Beyond their technical expertise, what truly stood out was how personally invested the team was in our success. They took the time to understand our business priorities and consistently aligned their work to meet those objectives.

We had an incredibly short and aggressive timeline that Envy Design Co. met, delivering an incredible website. After the websites were launched, leads continued to come in.

Their communication, attention to detail, and commitment to measurable outcomes made them feel like genuine partners rather than just a vendor. They are terrific.

Ready to build something worth envying?
Tell us a bit about your goals and we’ll be in touch as soon as we’re able to explore how we can help bring your vision to life.
Frequently asked questions.
What is an infographic?
A visual explanation that combines charts, diagrams, icons and short text to make data or ideas easy to understand.
Infographics work because people often grasp visuals faster than paragraphs of text or dense tables. A good infographic highlights what matters, shows relationships and patterns clearly and leaves out the noise. It might explain a process, compare options, summarize research or show results over time. Infographic design also needs to be accurate and honest, since a misleading chart does more harm than good. When done well, infographics make complex information memorable, shareable and much easier to act on.
Can you design infographics from our raw data?
Yes. We review your data, help decide what matters and design it clearly and accurately.
Raw data usually contains more than one infographic can show, so the first step is deciding what story it should tell. We look at your data, ask about your audience and goals and suggest the key points worth highlighting. Then we choose chart types and layouts that represent the numbers accurately and make them easy to understand. You remain responsible for the accuracy of the source data, and we'll flag anything that looks inconsistent. The result is an infographic that's clear, correct and on brand.
Where can infographics be used?
In reports, presentations, websites, social media, brochures and printed materials.
Infographics are flexible. In annual reports, they summarize results at a glance. In presentations, they help audiences follow complex points quickly. On websites and blogs, they make content more engaging and shareable. On social media, they deliver a clear message in a single scroll-stopping image. In brochures and print, they explain processes, products or data without long text. We can adapt one infographic into several formats and sizes, so you get more value from the same design across channels.
Can you create a set of charts in our brand style?
Yes. We can design chart and icon styles your team can reuse.
A consistent chart and icon style makes all your materials look connected, whether it's a report, a presentation or a social post. We define colours, fonts, line weights and labelling rules for charts, and create a set of icons that match your brand. Then we set them up in the tools your team uses, such as PowerPoint, Excel, Google Slides or Adobe, so your team can create new charts and graphics on brand. It's especially useful for organizations that share data regularly and want it to look professional every time.
How much does infographic design cost?
It depends on the number of graphics and the complexity of the data. Every project is quoted individually.
Infographic design costs vary with how many graphics you need, how complex the data or process is, how much analysis and content work is involved and whether you need multiple sizes or formats. A single simple chart is a smaller scope than a detailed infographic series or a reusable chart and icon system. Tell us about your data, where the infographics will be used and when you need them, and we'll send a clear quote so you know exactly what's included.
Related
Related services
Resources & articles
View all articles