Case study · Skin Investigation Network of Canada (SkIN Canada)
SkIN Canada
Website design and development for SkIN Canada, the national skin health research network, with an interactive research map, a project directory and a hub for trainee funding and workshops.
01 — Context
One network, coast to coast
The Skin Investigation Network of Canada, or SkIN Canada, launched in July 2020 with funding from the Canadian Institutes of Health Research. It's the country's only national skin research network, bringing researchers, clinicians and patients together to improve skin health through collaboration. Patient partners sit on every committee and project team.
In a few short years the network grew fast: new interdisciplinary research teams, trainee awards, workshops, webinars, a priority-setting initiative with patients and clinicians, a biobank registry and a data sharing agreement between institutions. All of it needed a home that made sense to a dermatologist, a graduate student and a patient advocate alike.
The network in numbers
Built for scale
- Year SkIN Canada launched
- 2020With funding from CIHR.
- Page designs
- 40+From committees and working groups to forms and publications.
- Research sites
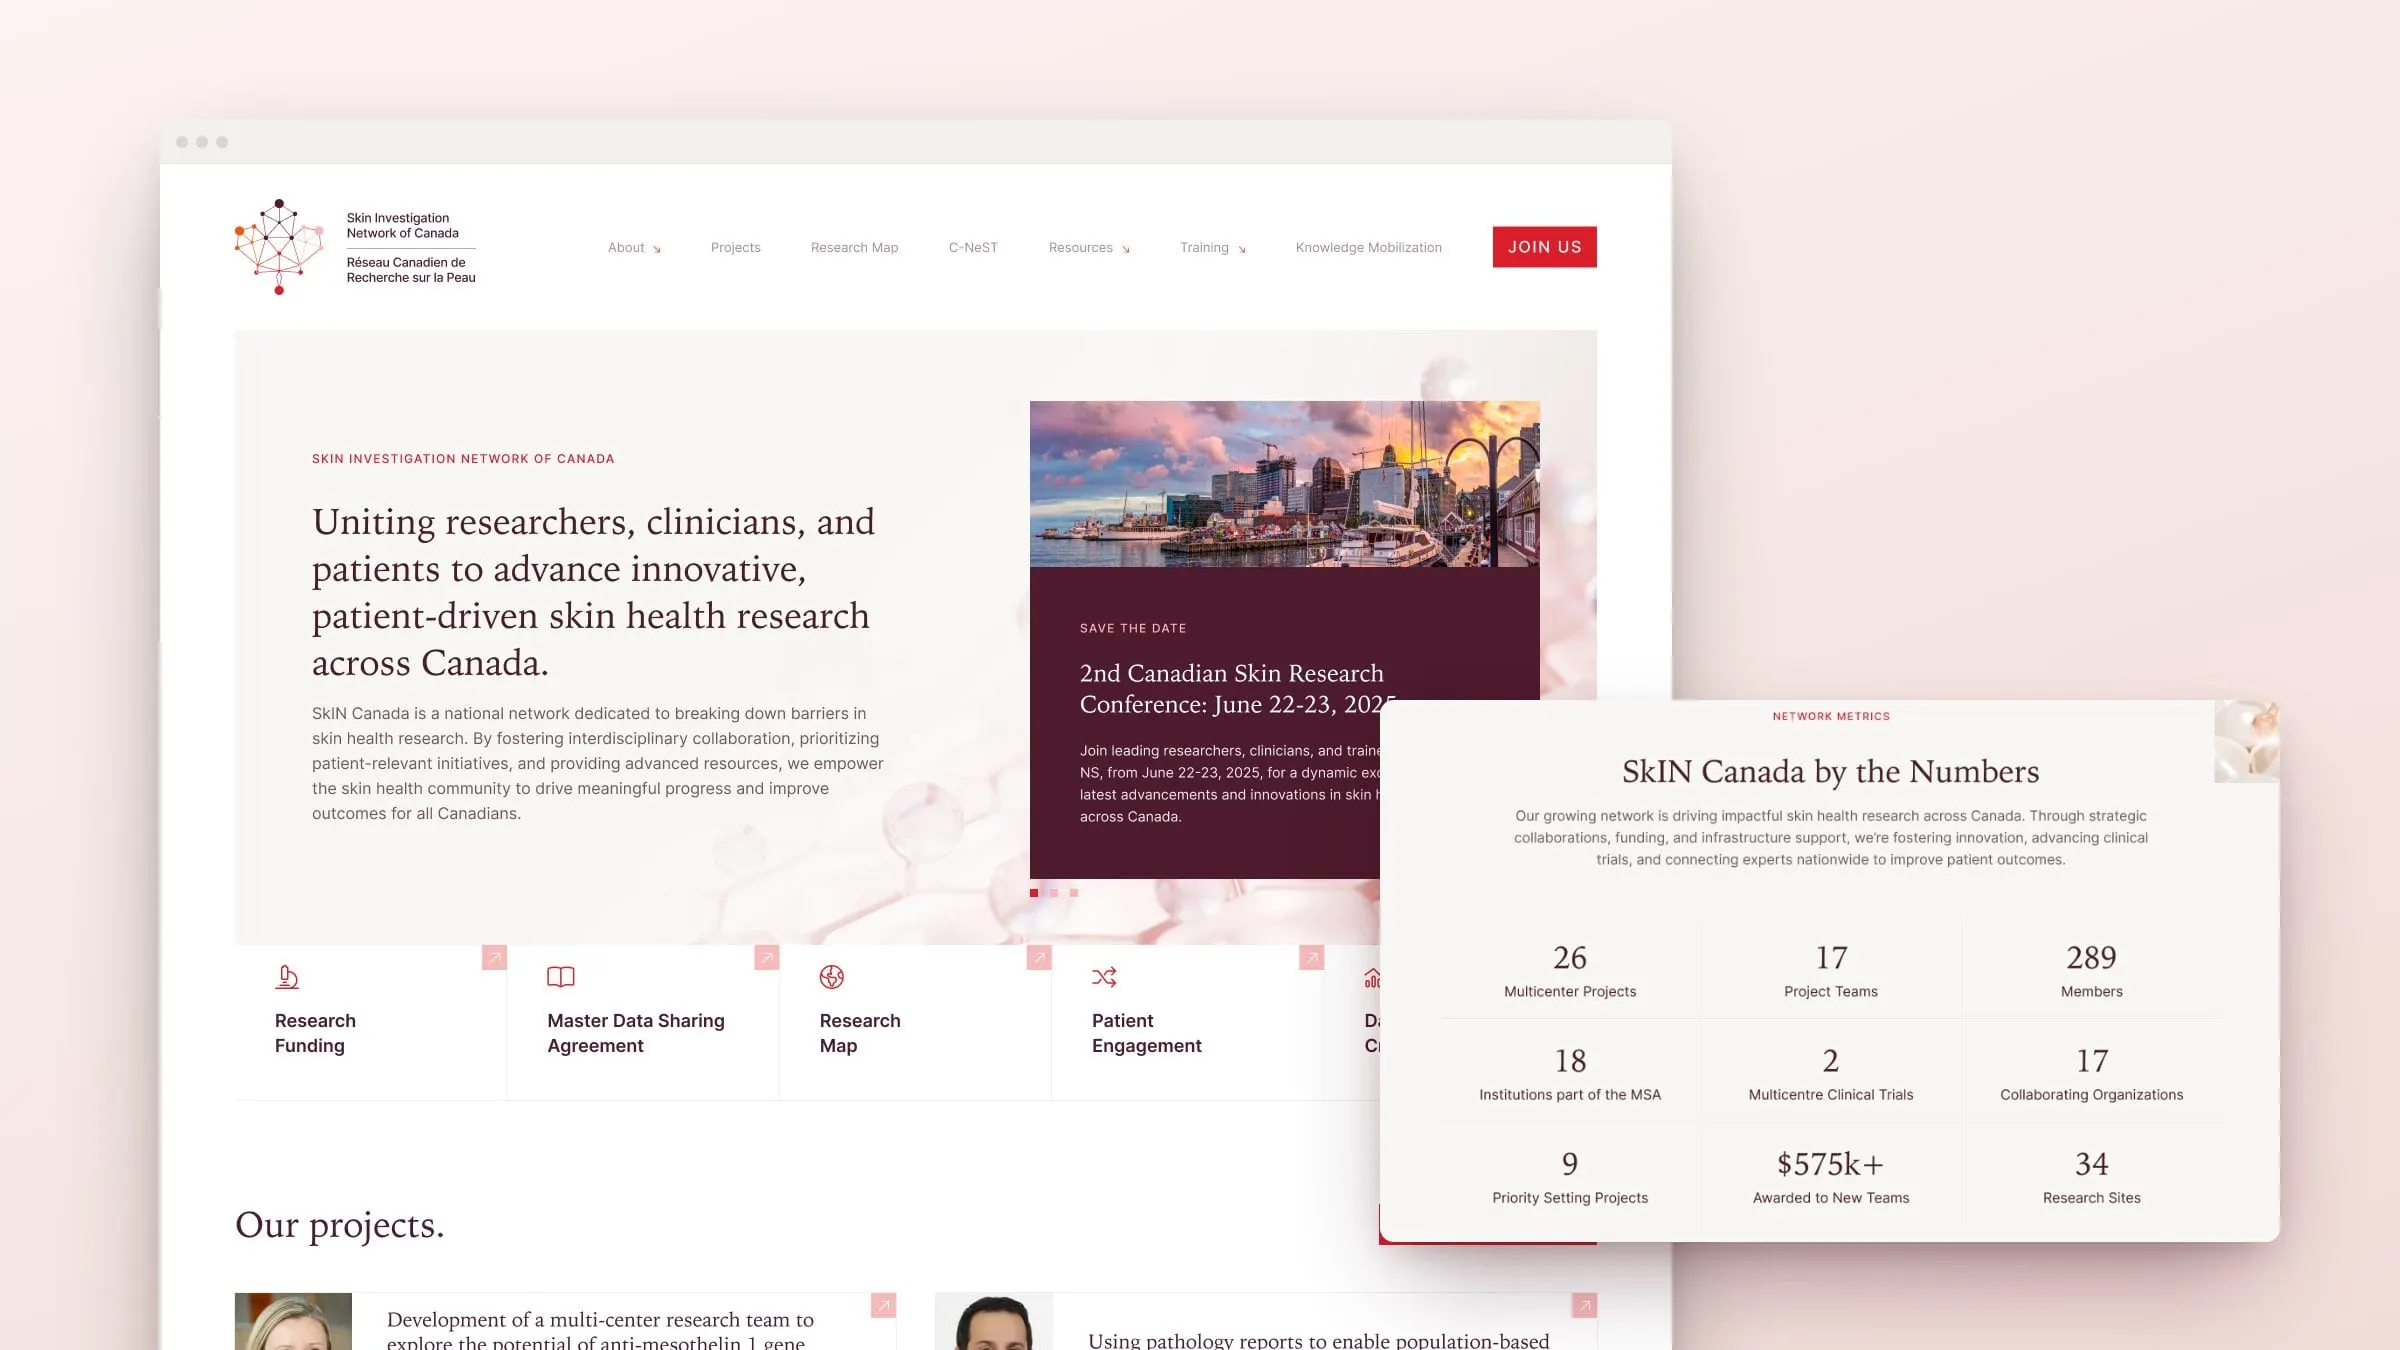
- 34As listed on the network's homepage.
- Members
- 289As listed on the network's homepage.
02 — Structure
A big network, made navigable
The challenge was volume. SkIN Canada has an executive committee, a steering committee, a training committee, a translational research committee, a patient advisory council and five working groups, from skin of colour to rare skin disease. It runs dozens of multicentre projects, two trainee awards, workshops, webinars, newsletters, publications and a set of membership and biobank forms.
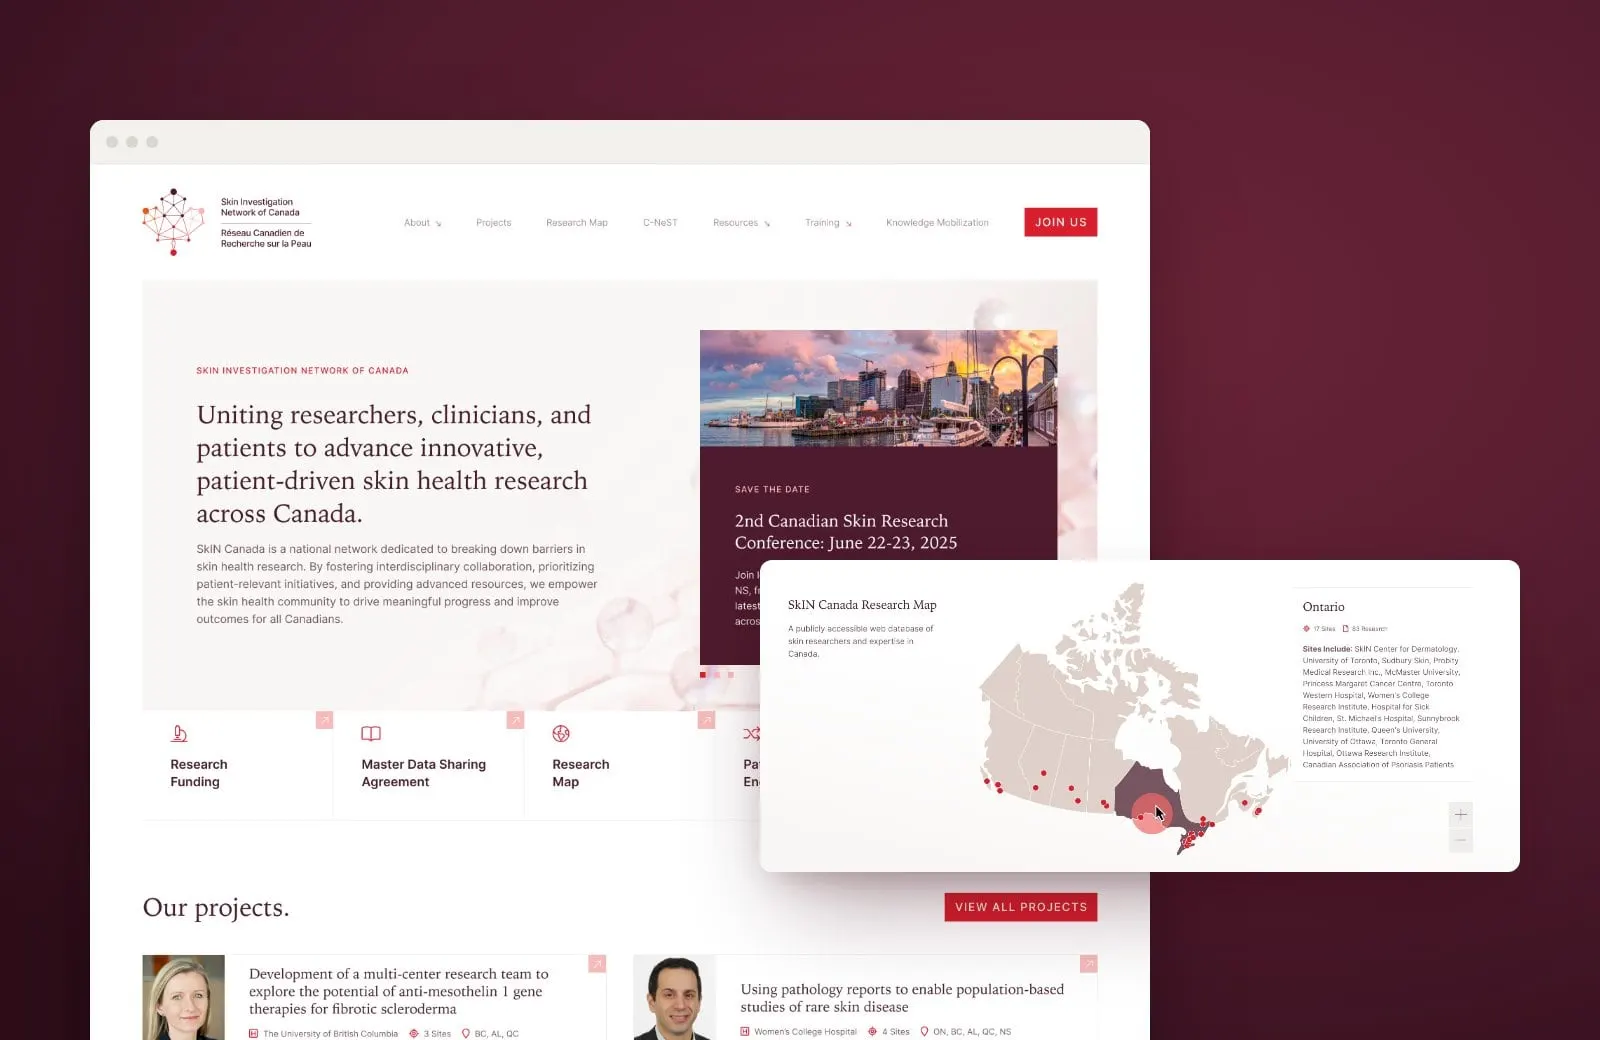
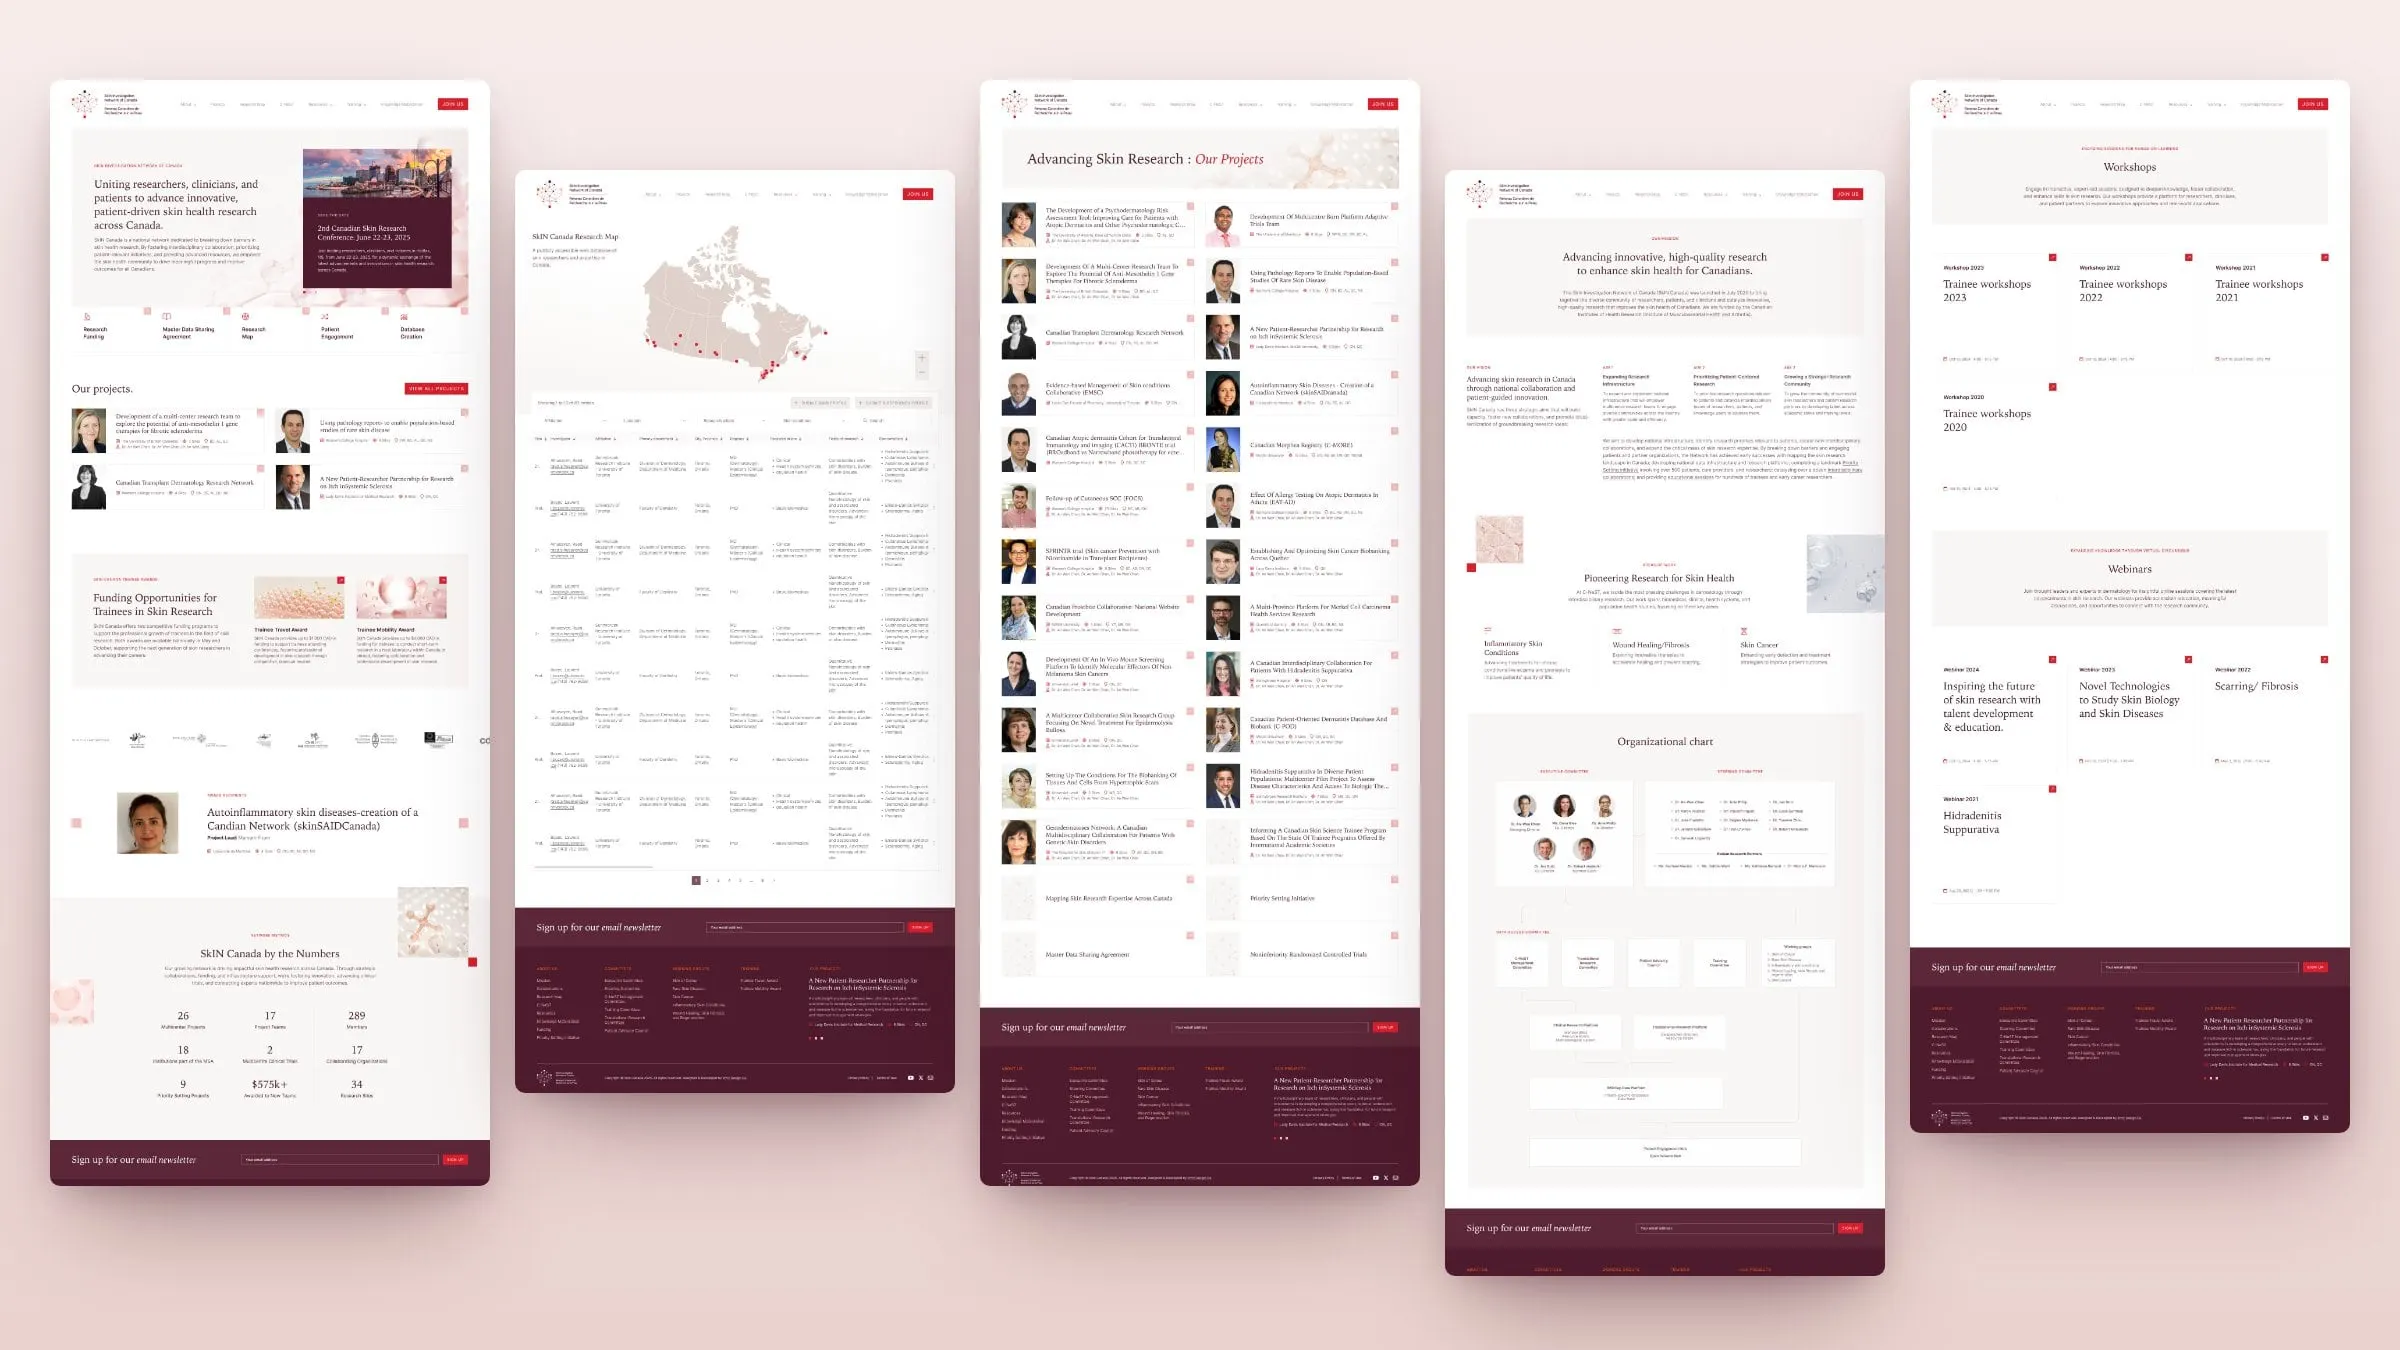
We organized it into a small, predictable menu (About, Projects, Research Map, C-NeST, Resources, Training and Knowledge Mobilization) with one clear Join Us button. The homepage is a front door to all of it: the mission in one sentence, quick links to funding, data sharing, the map, patient engagement and database creation, then featured projects, trainee awards, collaborators and the network's numbers.
It's the same thinking we bring to medical sites with 20+ services: structure first, decoration second.
03 — The research map
Who's doing what, and where
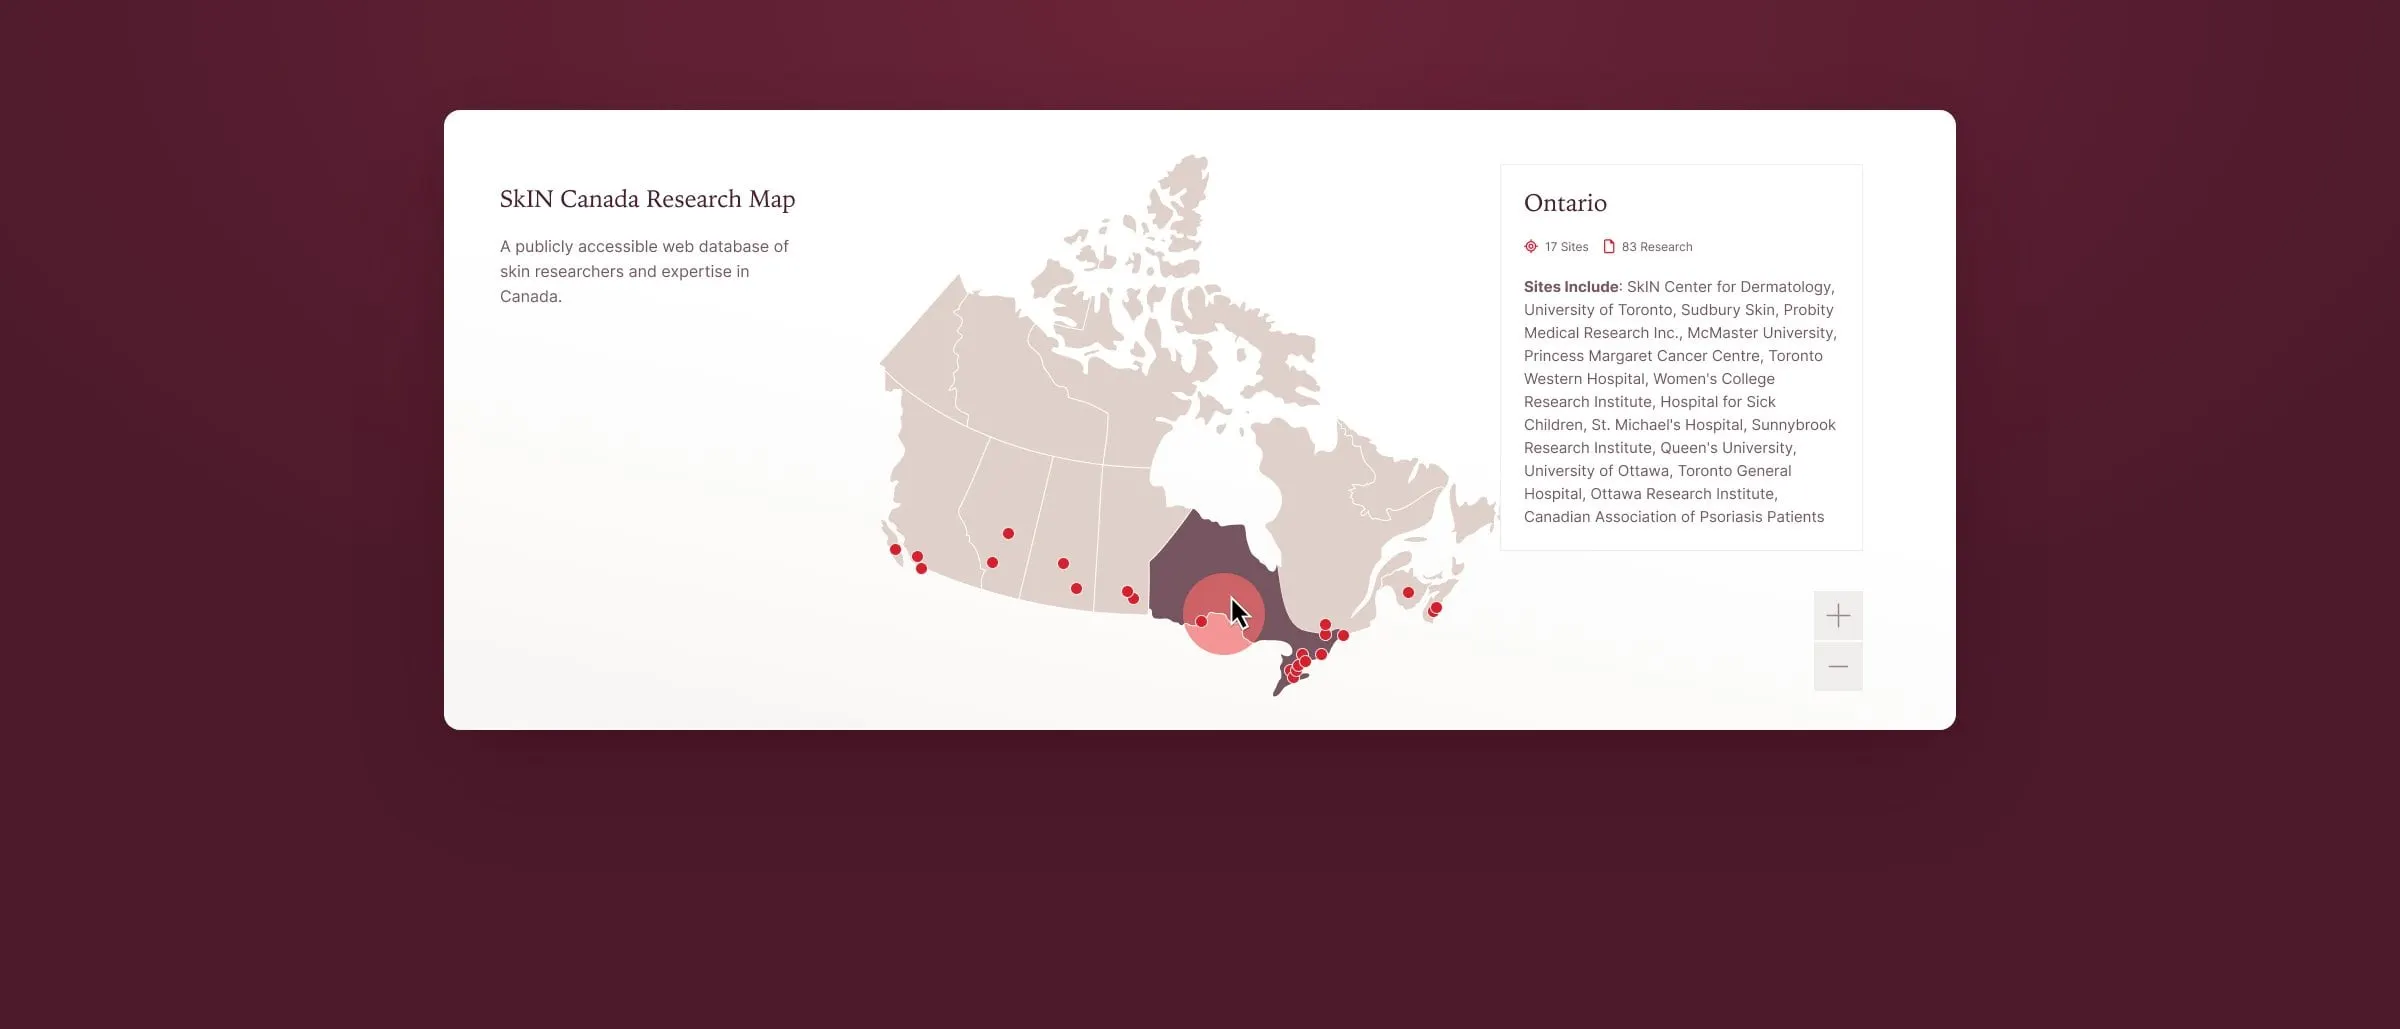
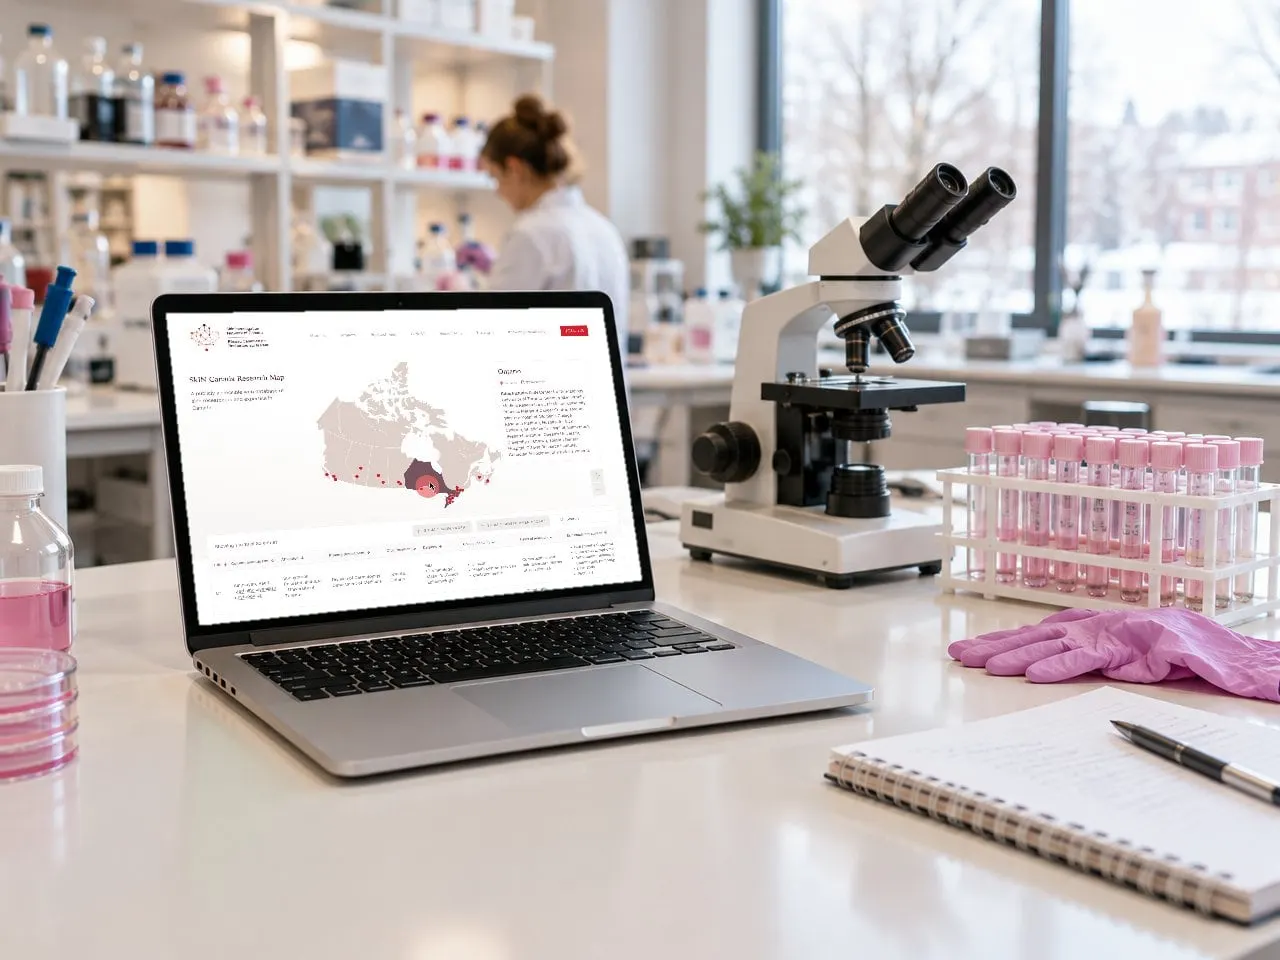
The feature we're proudest of is the research map, a public, searchable database of skin researchers and their expertise across Canada. A map of the country sits above a sortable table of investigators, affiliations, departments, degrees, research pillars and skin conditions studied.
The two work together. Hover over a row and that researcher's location lights up on the map. Click a province and an info card shows how many sites and research profiles it holds, and which institutions are included, while the table filters to match. Researchers can submit a main profile or a biospecimen profile right from the page, so the map keeps growing on its own.
Projects and training
Every project, every opportunity
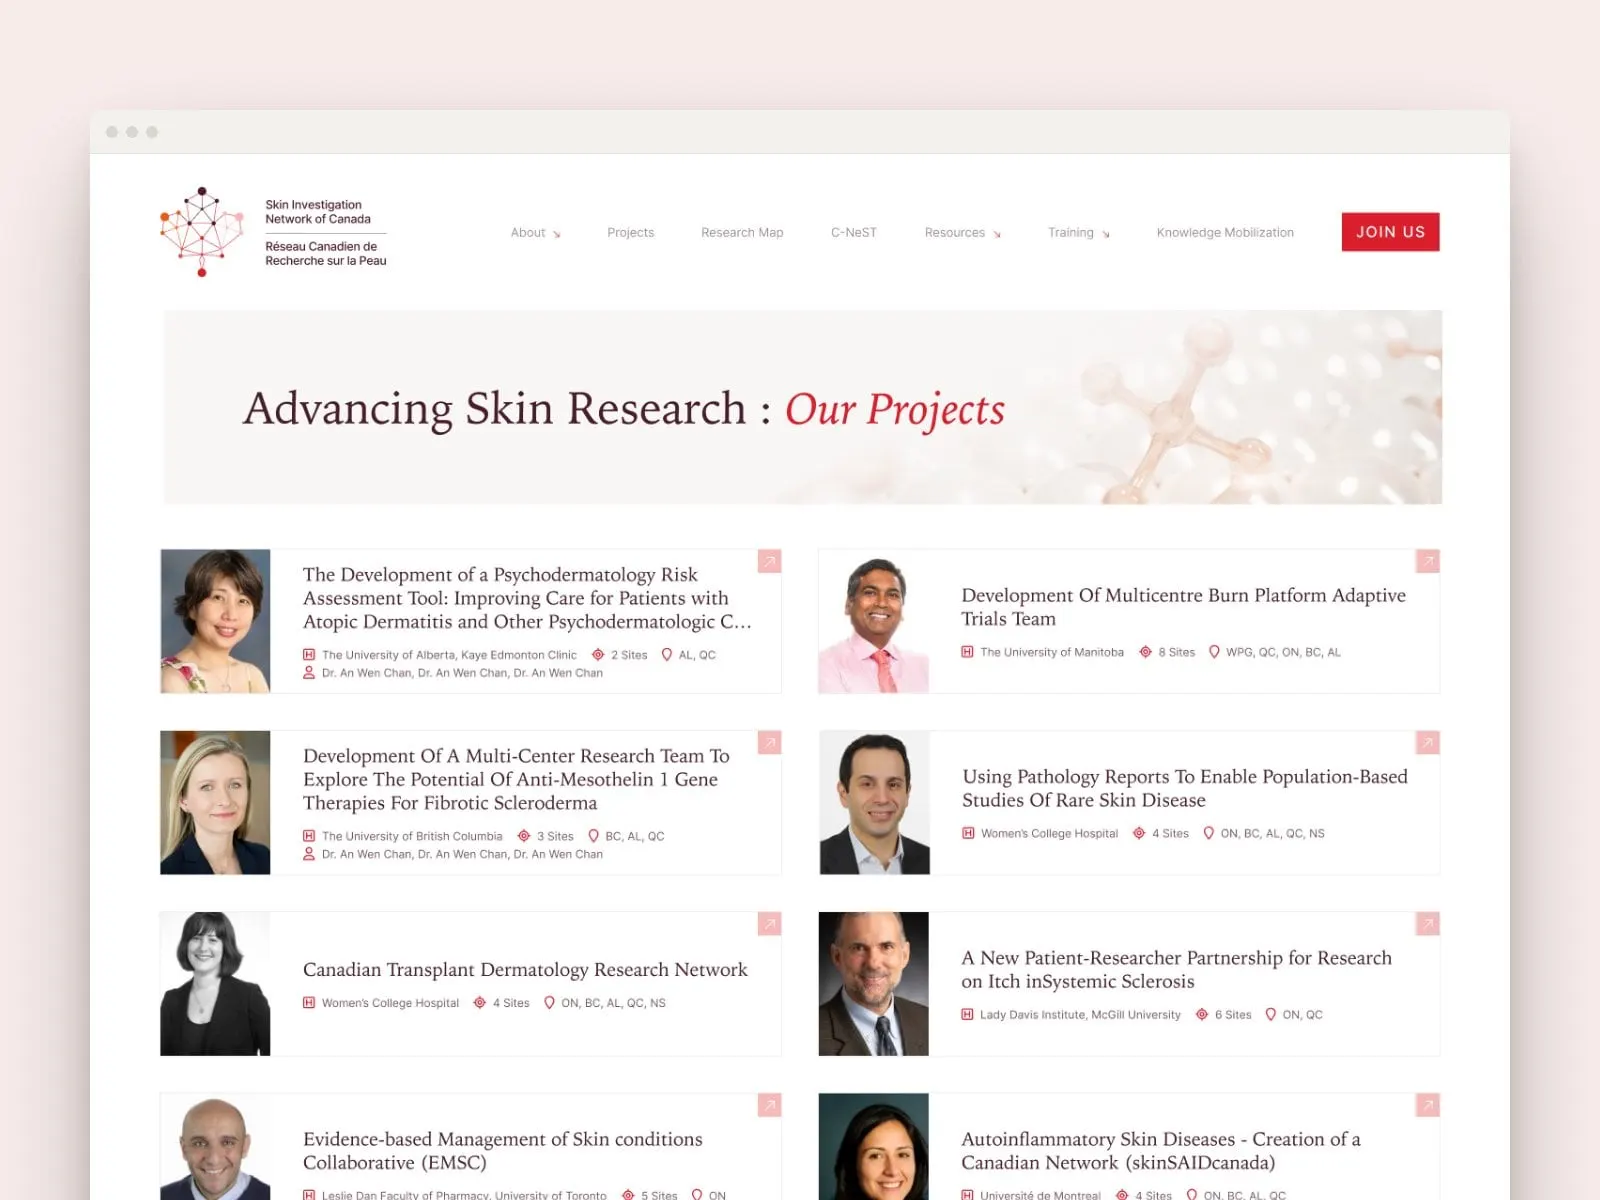
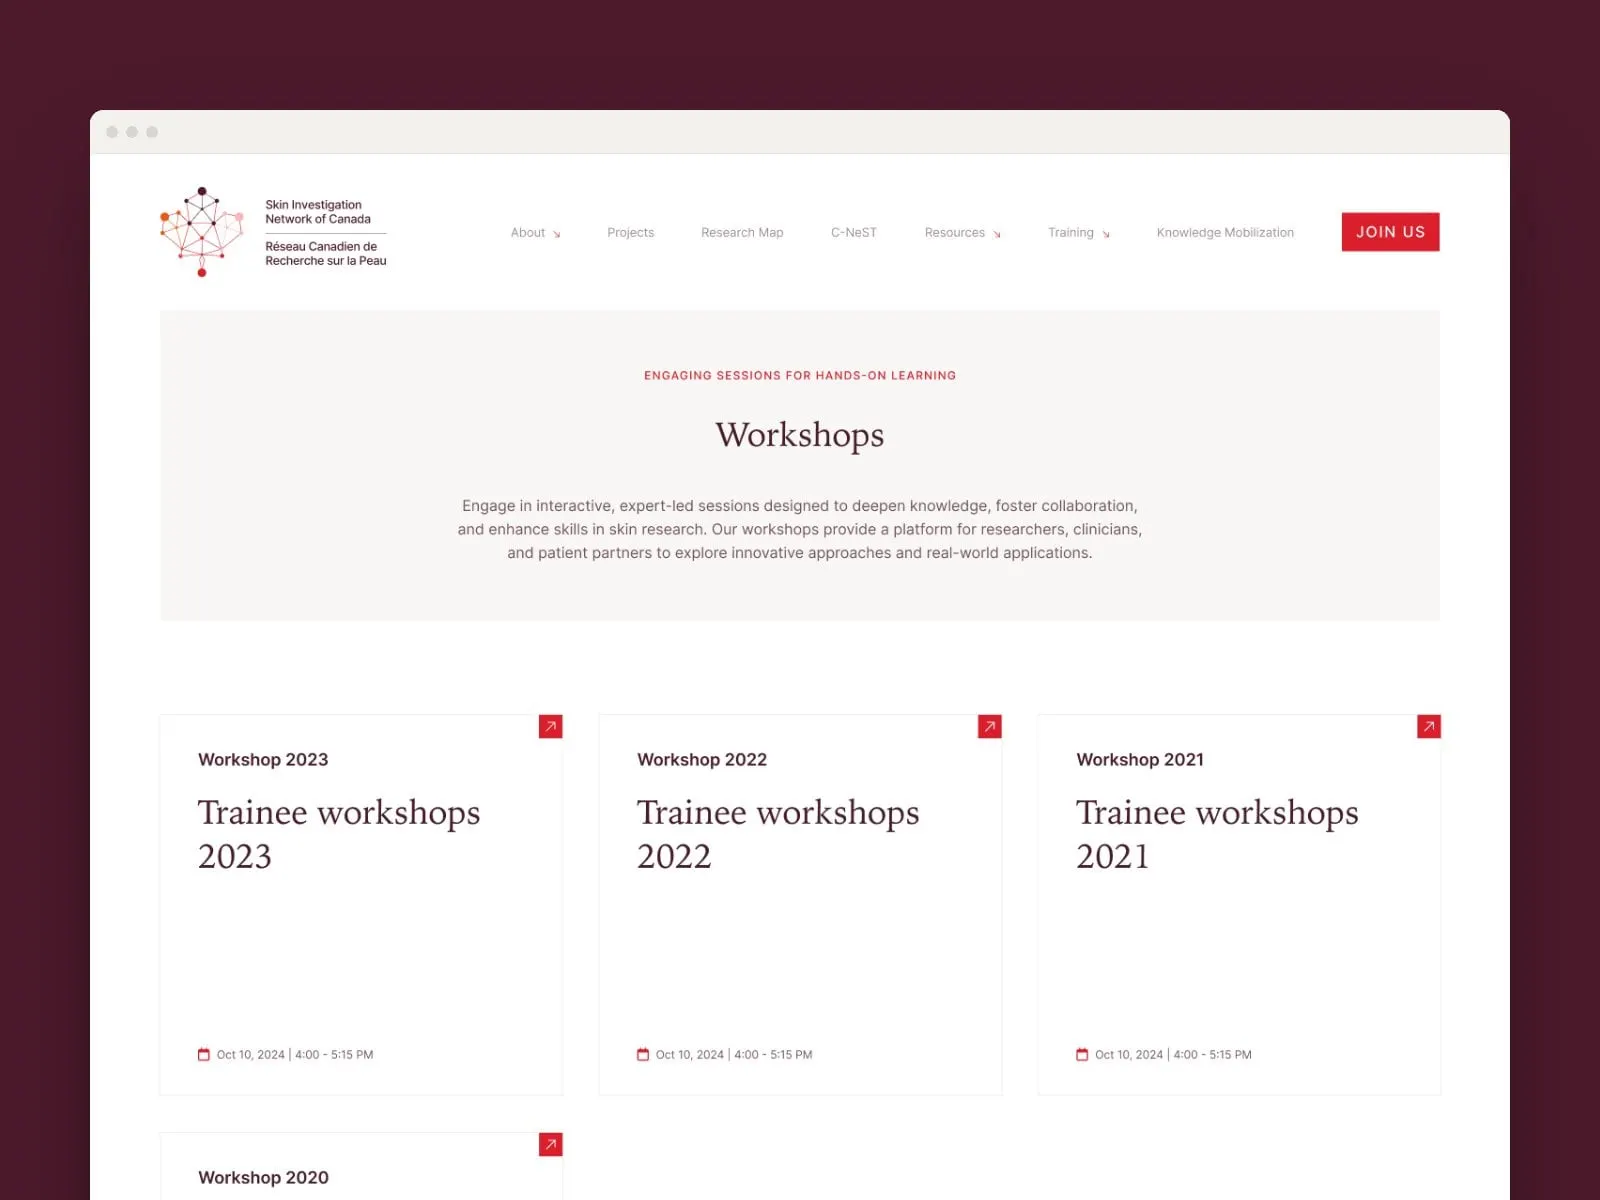
The projects directory gives each multicentre study a card with the lead investigator's photo, lead institution, number of sites and provinces involved. Training pages collect workshops, webinars and the Trainee Travel and Trainee Mobility awards in one place, with clear dates and outcomes.
A warm palette of blush, burgundy and signal red, a classic serif for headlines and a clean sans for data keep a dense, academic site feeling human.
04 — People and process
Showing how it all connects
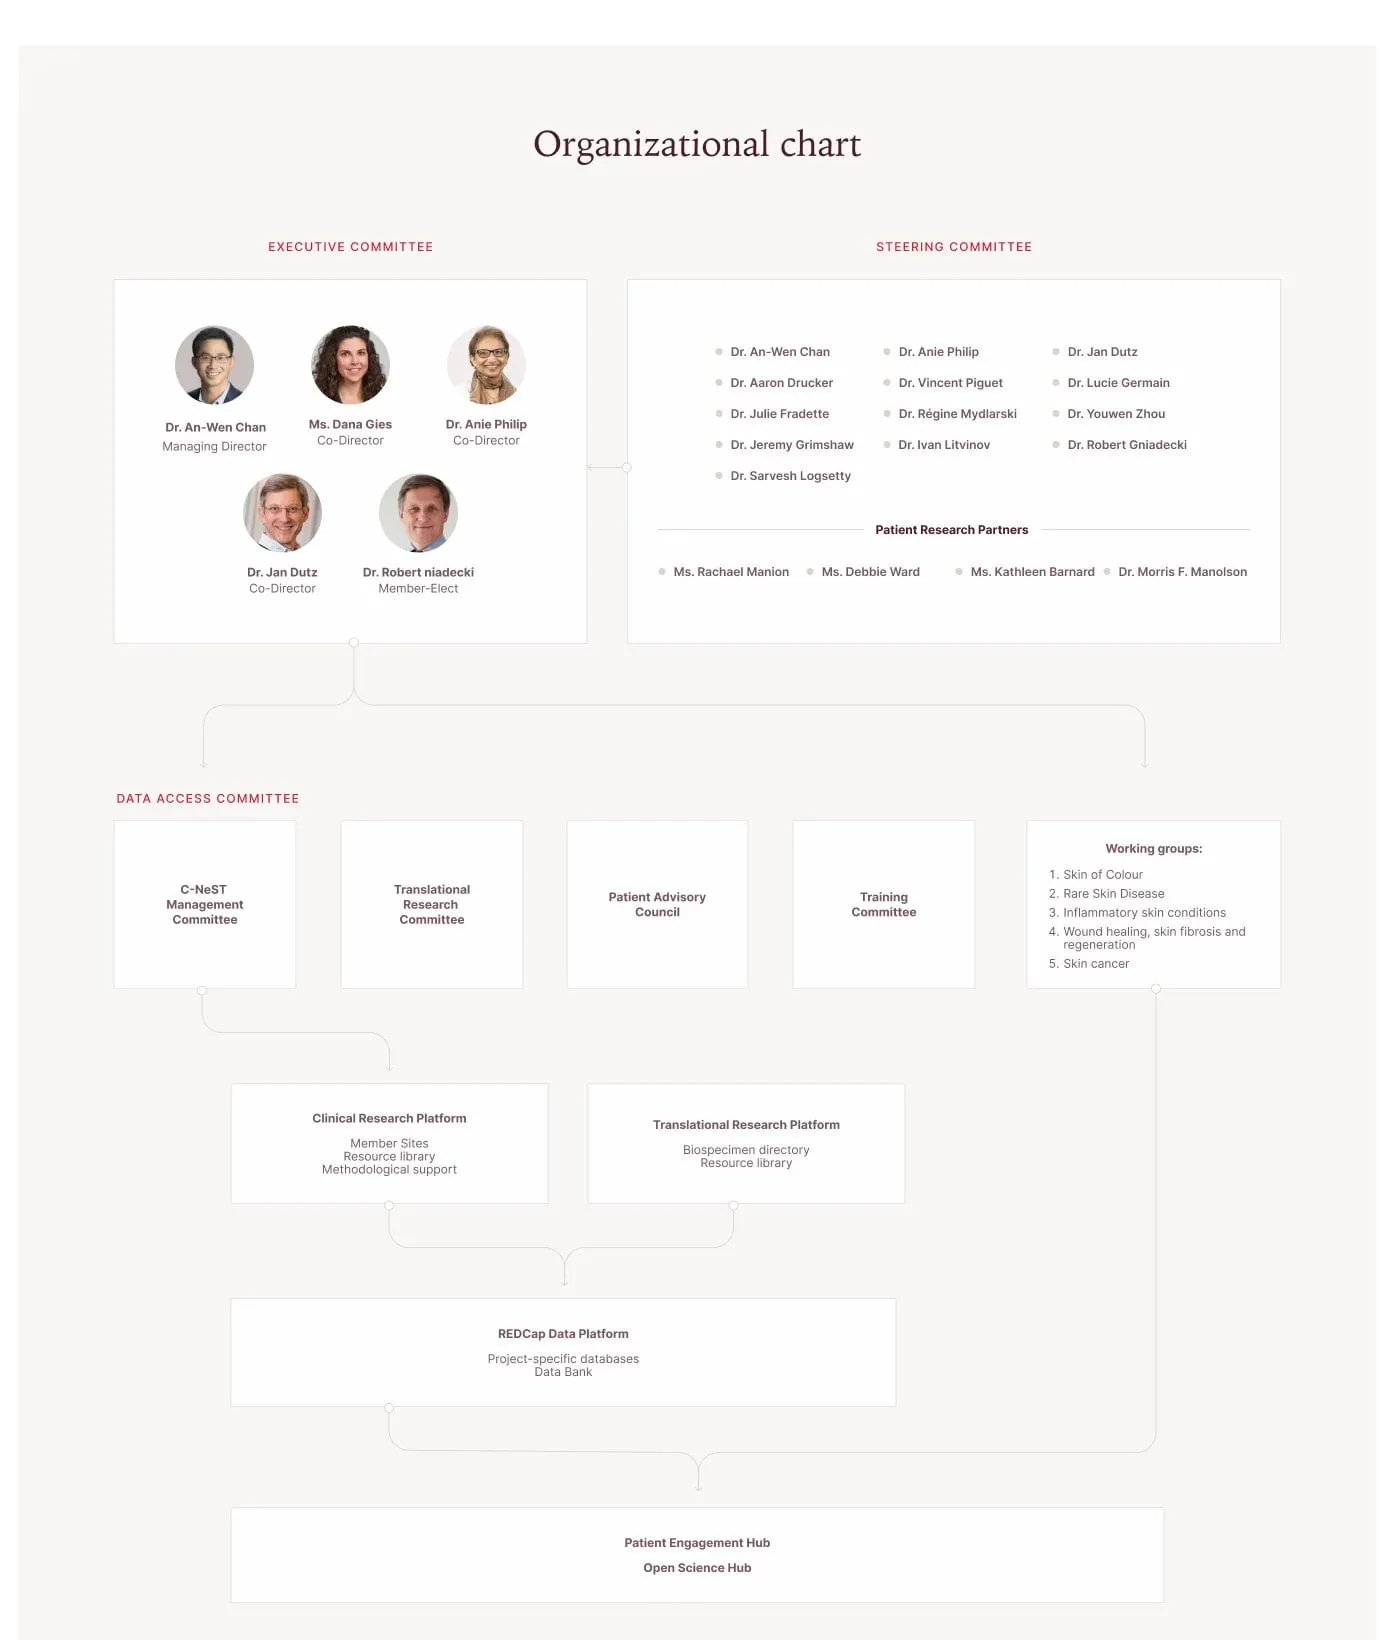
For a network this size, people want to understand who decides what. The mission page includes an organizational chart that maps the executive and steering committees, patient research partners, data access committee, working groups and the platforms that support them, from clinical and translational research platforms to the REDCap data platform and the patient engagement hub.
Behind the scenes, the site also carries the practical pieces: membership applications, researcher and biobank profile submissions, a master data sharing agreement and newsletter archives, all designed to the same system. If you're planning something similar, our guide to healthcare website accessibility is a good place to start. For more research and life sciences work, see Precision Biomonitoring.
Organizational chart
Clarity at every level
Instead of a wall of names, the chart reads top to bottom: leadership, committees and working groups, then the platforms that turn research into shared resources.
What we delivered
<p>Running a research network, association or clinic with a lot to say? See more of our <a href="/industries/healthcare">health care work</a>.</p>